Text Solution
Verified by Experts


Similar Questions
Explore conceptually related problems
Recommended Questions
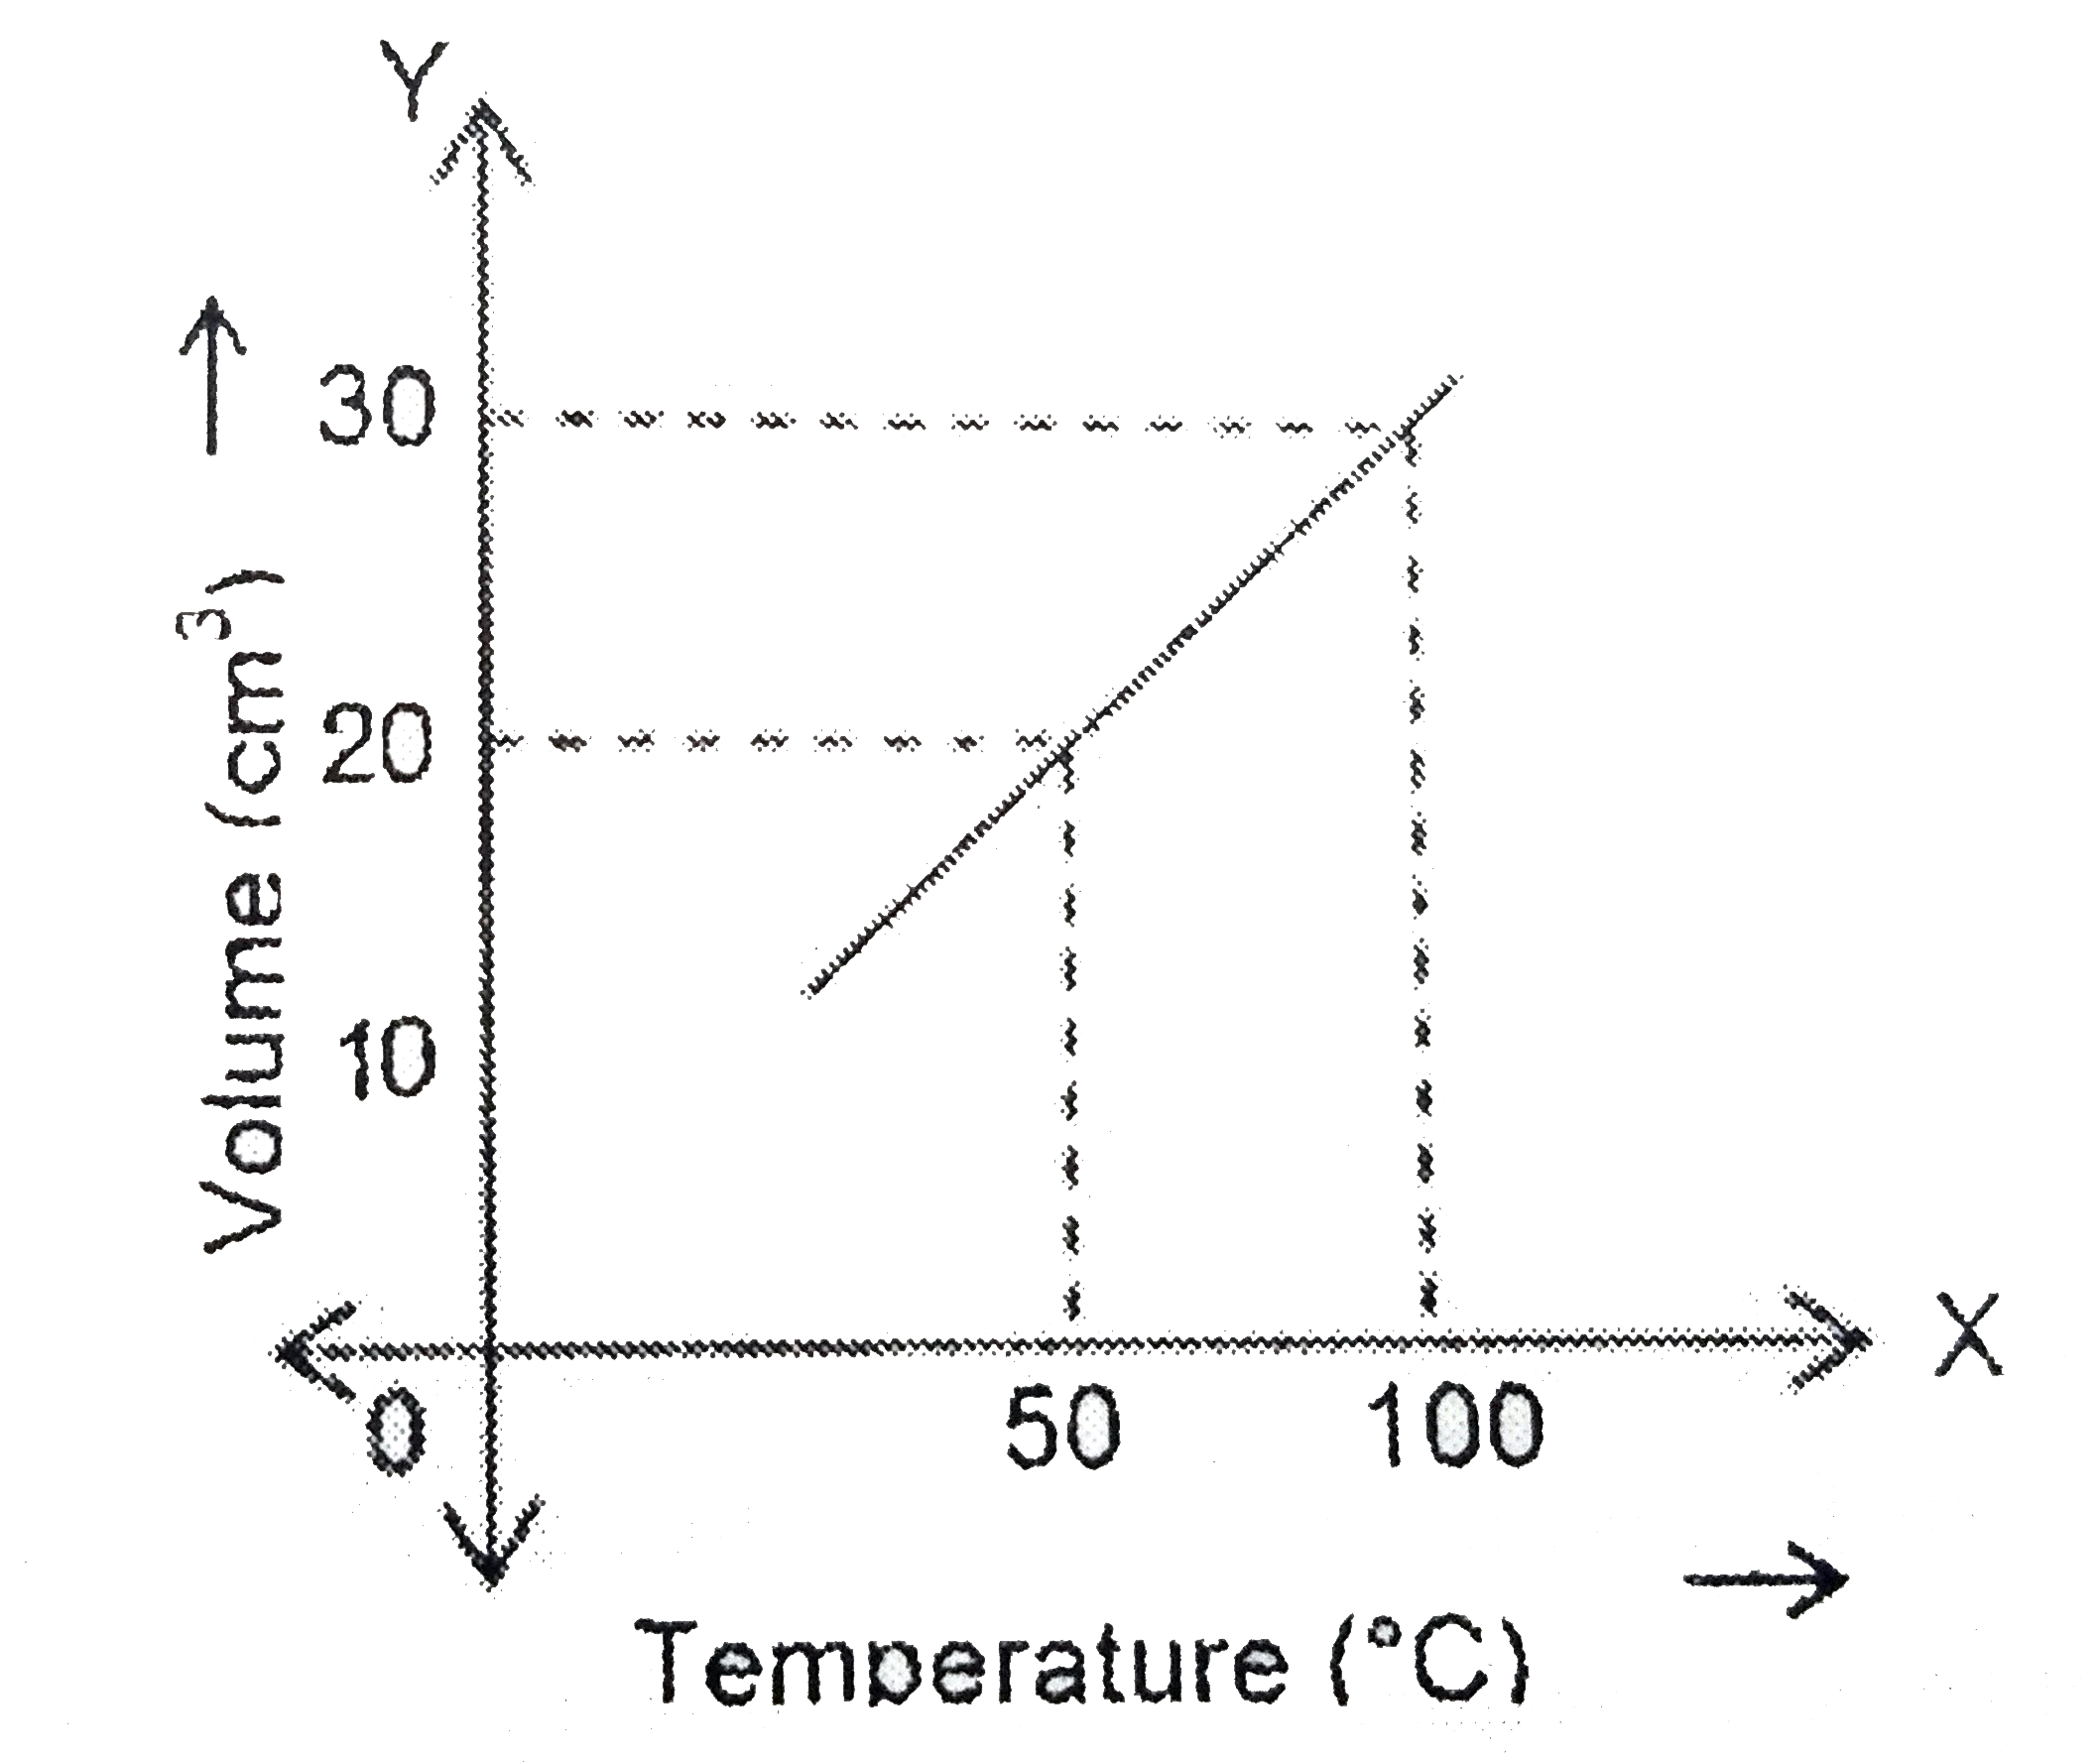
- The change in volume of a gas with change in temperature is plotted on...
Text Solution
|
- The temperature of 5 mol of gas which was held at constant volume was ...
Text Solution
|
- The change in volume of a gas with change in temperature is plotted on...
Text Solution
|
- The temperature of 5 moles of a gas at constant volume is changed from...
Text Solution
|
- The temperature of O(2) gas is changed from 25^(@)C to 50^(@)C then ch...
Text Solution
|
- As shown by the graph, how does the density change with the change in ...
Text Solution
|
- When the temperature of 5 mol of a gas is changed from 100^@C to 120^@...
Text Solution
|
- The temperature of 5 moles of a gas at constant volume is changed fro...
Text Solution
|
- Calculate the entropy change when 50 gm water changes the temperature ...
Text Solution
|