


Similar Questions
Explore conceptually related problems
Recommended Questions
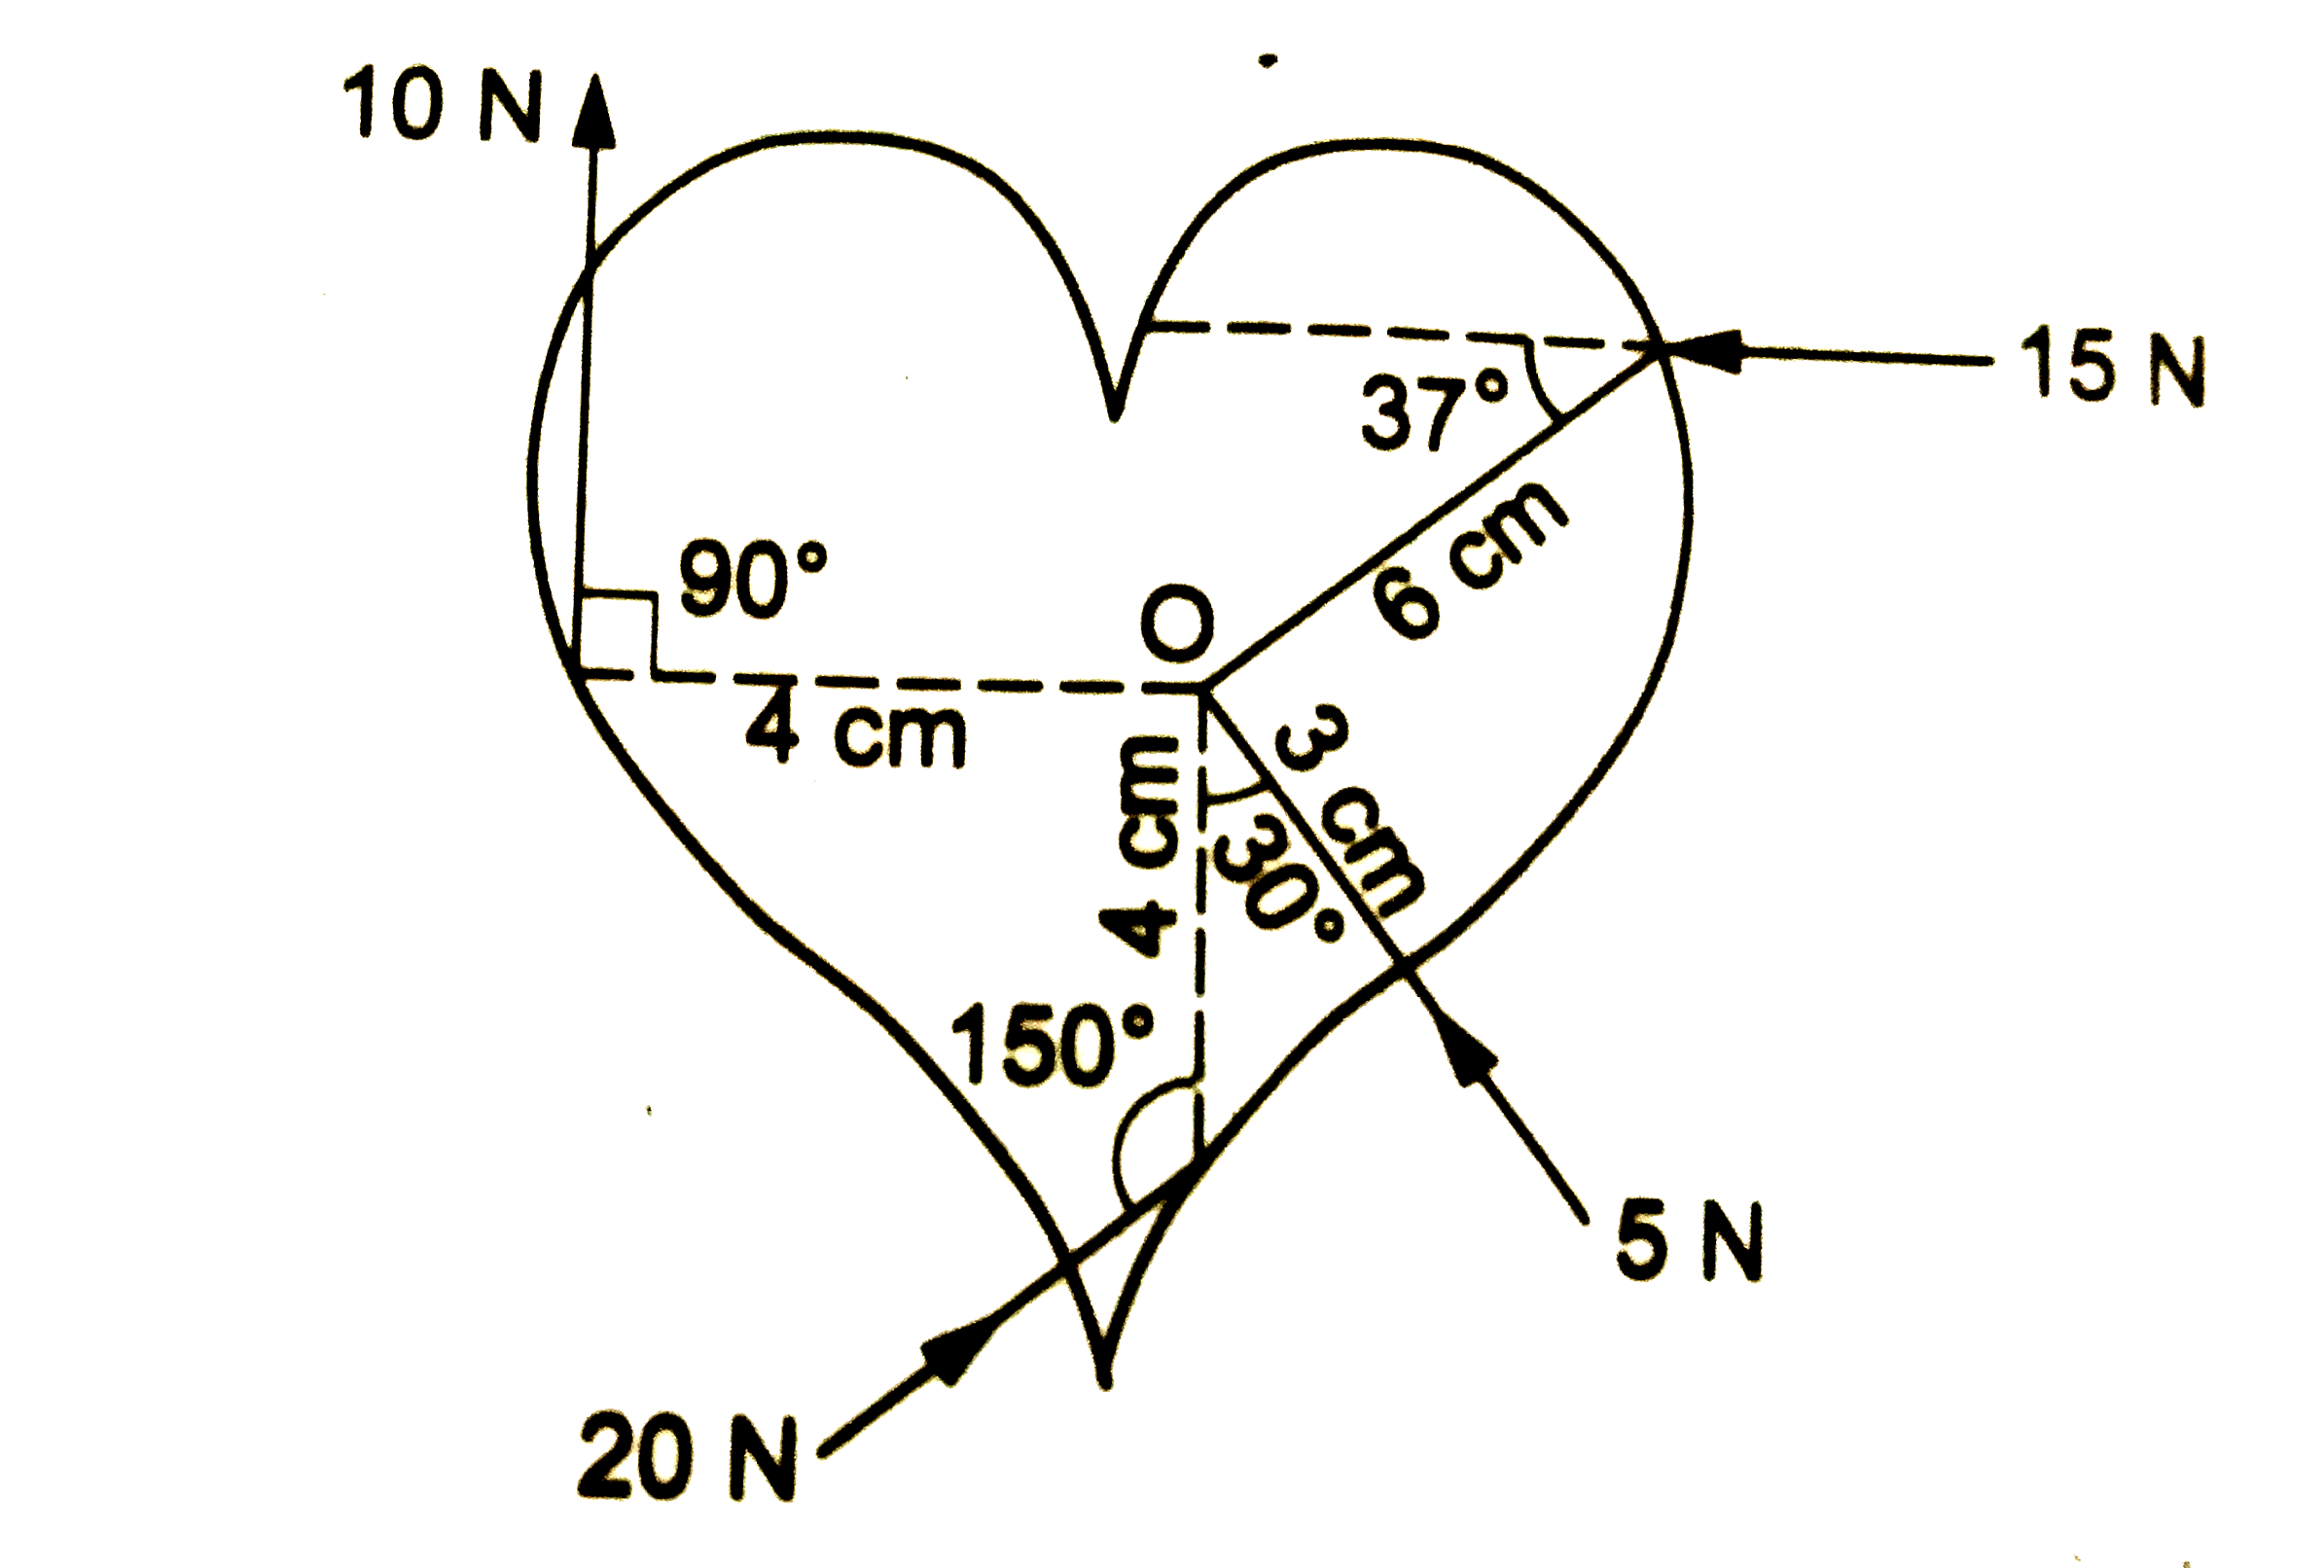
- चित्र 18.E2 में प्रदर्शित बस्तु पर O के परितः कुल बल-आघूर्ण की गणना कर...
Text Solution
|
- एकसमान चुम्बकीय क्षेत्र में धारावाही कुंडली पर बल आघूर्ण
Text Solution
|
- बल आघूर्ण , गतिज उर्जा, कार्य पर प्रशन
Text Solution
|
- विद्युत धारावाही चालक पर चुंबकीय बल | दो समांतर विद्युत धाराओं के बीच ...
Text Solution
|
- धारावाही चालक पर बल तथा बल आघूर्ण
Text Solution
|
- एकसमान चुम्बकीय क्षेत्र में धारावाही कुंडली पर बल आघूर्ण चल कुंडली धार...
Text Solution
|
- पिछले वर्ष के धारावाही कुंडली पर बल आघूर्ण पर प्रश्न
Text Solution
|
- एकसमान चुम्बकीय क्षेत्र में धारावाही कुंडली पर बल आघूर्ण
Text Solution
|
- धारावाही कुंडली पर बल आघूर्ण पर आंकीक प्रश्न
Text Solution
|