


KCET PREVIOUS YEAR PAPERS-KARNATAKA CET 2003-PHYSICS
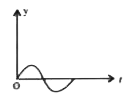
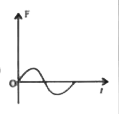
- The displacement time graph of a particle executing SHM is as shown in...
Text Solution
|
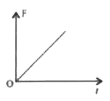
- Which of the following sets of concurrent forces may be in equilibrium...
Text Solution
|
- Young's modulues of perfectly rigid body material is-
Text Solution
|
- An ideal monoatomic gas at 27^(@)C is compressed adiabatically to (8)/...
Text Solution
|
- A sample of ideal monoatomic gas is taken round the cycle ABCA as show...
Text Solution
|
- A charge q is placed at the centre of the line joining two equal charg...
Text Solution
|
- The inward and outward electric flux from a closed surface are respect...
Text Solution
|
- In the circuit as shown in the figure The effective capacitance b...
Text Solution
|
- Capacitance of a parallel plate capacitor becomes 4//3 times its origi...
Text Solution
|
- A charged particle of mass m and charge q is released from rest in an ...
Text Solution
|
- If a ray of light in a denser medium strikes a rarer medium at an angl...
Text Solution
|
- Waves that can not be polarized are
Text Solution
|
- The phenomenon of re-irradiation of absorbed light is called
Text Solution
|
- As a result of interference of two coherent sources of light, energy i...
Text Solution
|
- There are n(1) photons of frequency v(1) in a beam of light. In an equ...
Text Solution
|
- A bucket full of hot water is kept in a room. It cools from 75^(@)C to...
Text Solution
|
- A fish, looking up through the water sees the outside world contained ...
Text Solution
|
- A given ray of light suffers minimum deviation in an equilateral prism...
Text Solution
|
- The aperture of the objective lens of a telescope is made large so as ...
Text Solution
|
- A lamp hanging 4 metres above the table is lowered by 1 metre. Illumin...
Text Solution
|