


Similar Questions
Explore conceptually related problems
Recommended Questions
- The v-x graph for a car in a race on a straight road is given. Identif...
Text Solution
|
- The velocity-time graph of a car moving along a straight road is shown...
Text Solution
|
- A car is moving on a straight road. The velocity of the car varies wit...
Text Solution
|
- The velocity- time graph of car moving on a straight track is given be...
Text Solution
|
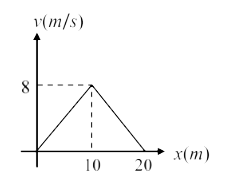
- Depict the shown v -x graph a - x graph:
Text Solution
|
- Depict the shown v-x graph in a-x graph :
Text Solution
|
- The velocity-time graph of a car moving along a straight road is shown...
Text Solution
|
- सीधी सड़क पर चलती एक कार की चाल समय के साथ ग्राफ चित्र में दिखा...
Text Solution
|
- The v-x graph for a car in a race on a straight road is given. Identif...
Text Solution
|