


Similar Questions
Explore conceptually related problems
Recommended Questions
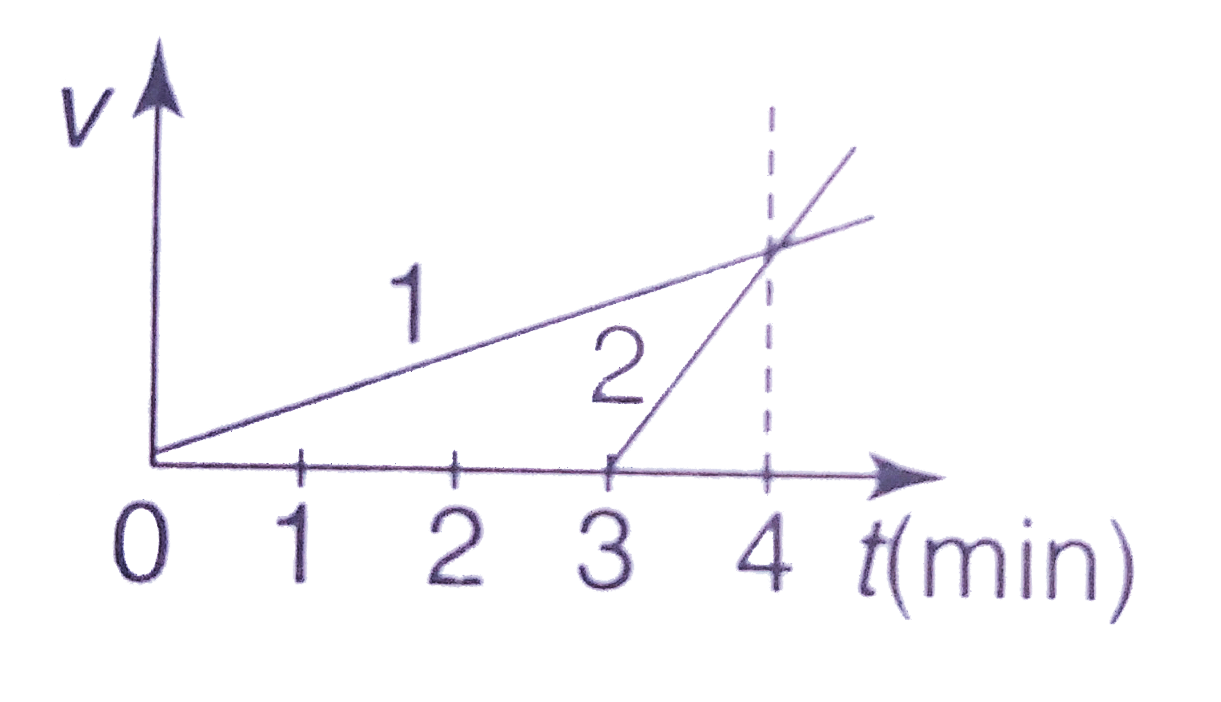
- The drawing shows velocity (v) versus time (t) graphs for two cyclists...
Text Solution
|
- The acceleration versus time graph of a particle moving along a straig...
Text Solution
|
- The drawing shows velocity (v) versus time (t) graphs for two cyclists...
Text Solution
|
- The fig. shows the v-t graph of a particle moving in straight line. Fi...
Text Solution
|
- A particle starts to move along a straight line. The acceleration vers...
Text Solution
|
- Figure shows the velocity time graph of a particle moving along straig...
Text Solution
|
- A body A moves with a uniform acceleration a and zero initial velocity...
Text Solution
|
- At time t = 0, two bodies A and B are at the same point. A moves with ...
Text Solution
|
- A and B are two points 150 km apart on a highway. Two cars start from ...
Text Solution
|