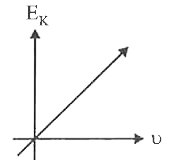
A
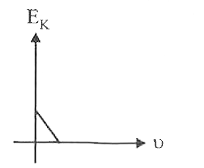
B
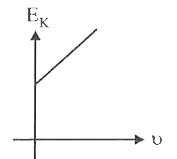
C
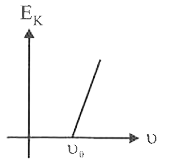
D
Text Solution
Verified by Experts
The correct Answer is:


Topper's Solved these Questions
DUAL NATURE OF RADIATION AND MATTER
DISHA PUBLICATION|Exercise EXERCISE -2 : CONCEPT ALLPLICATOR|30 VideosDUAL NATURE OF RADIATION AND MATTER
DISHA PUBLICATION|Exercise EXERCISE -2 : CONCEPT ALLPLICATOR|30 VideosCURRENT ELECTRICITY
DISHA PUBLICATION|Exercise EXERCISE-2 Concept Applicator|23 VideosELECTRIC CHARGES AND FIELDS
DISHA PUBLICATION|Exercise Exercise - 2 : Concept applicator|24 Videos
Similar Questions
Explore conceptually related problems
DISHA PUBLICATION-DUAL NATURE OF RADIATION AND MATTER-EXERCISE -1 : CONCEPT BUILDER
- A small photocell is placed at a distance of 4 m from a photosensitive...
Text Solution
|
- In a photoelectric effect experiment, for radiation with frequency v0 ...
Text Solution
|
- Which one of the following graphs represents the variation of maximum ...
Text Solution
|
- A source of light is placed at a distance of 50 cm from a photocell an...
Text Solution
|
- The stopping potential (V(0)) versus frequency (v) plot of a substance...
Text Solution
|
- The work functions of metals A and B are in the ratio 1 : 2. If light ...
Text Solution
|
- When a metal surface is illuminated by light wavelengths 400 nm and 25...
Text Solution
|
- In a photoelectric experiment, with light of wavelength lamda , the fa...
Text Solution
|
- Two identical photocathodes receive light of frequencies f1 and f2. If...
Text Solution
|
- In a photoelectric effect measurement, the stoppingg potential for a g...
Text Solution
|
- A photo cell is illuminated by a small bright source placed 1m away Wh...
Text Solution
|
- For intensity I of a light of wavelength 5000 Å the photoelectron satu...
Text Solution
|
- The maximum velocity of the photoelectrons emitted from the surface is...
Text Solution
|
- In an experiment on photoelectric effect, a student plots stopping pot...
Text Solution
|
- A point source causes photoelectric effect from a small metal plate. W...
Text Solution
|
- In a photoelectric experiment, the wavelength of the incident light is...
Text Solution
|
- When a point light source, of power W, emitting monochromatic light of...
Text Solution
|
- Find the number of photons emitted per second by a 25 W source of mono...
Text Solution
|
- X-rays are
Text Solution
|
- The ratio of the energy of an X - ray photon of wavelength 1 Å to that...
Text Solution
|