A
B
C
D
Text Solution
Verified by Experts
The correct Answer is:


Recommended Questions
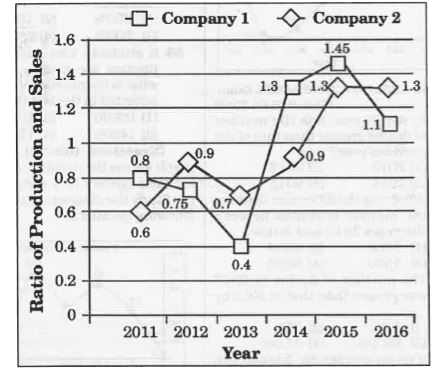
- The line chart given below shows the ratio of poduction to sales of tw...
Text Solution
|
- Formation of table for the production and sales of a company in differ...
Text Solution
|
- The inequation represented by the graph given below is : <img src="htt...
Text Solution
|
- The table given below represents the respective ratio of the productio...
Text Solution
|
- There are two car manufacturing companies (Company X and Company Y). T...
Text Solution
|
- The line chart given below shows the ratio of production to sales of t...
Text Solution
|
- Production and sales volume of a company in different years (in lakh t...
Text Solution
|
- The line chart given below shows the ratio of poduction to sales of tw...
Text Solution
|
- The line chart given below shows the ratio of production to sales of t...
Text Solution
|