A
B
C
D
Text Solution
Verified by Experts
The correct Answer is:


Recommended Questions
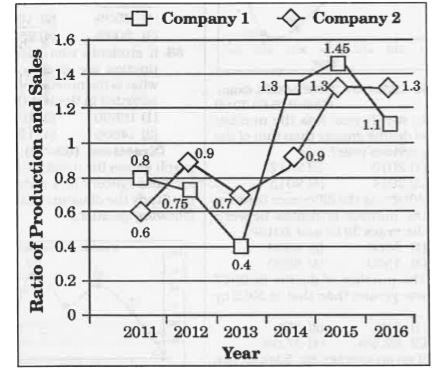
- The line chart given below shows the ratio of poduction to sales of tw...
Text Solution
|
- There are two car manufacturing companies (Company X and Company Y). T...
Text Solution
|
- There are two car manufacturing companies (Company X and Company Y). T...
Text Solution
|
- The line chart given below shows the ratio of production to sales of t...
Text Solution
|
- The line chart given below shows the ratio of poduction to sales of tw...
Text Solution
|
- The line chart given below shows the ratio of poduction to sales of tw...
Text Solution
|
- The line chart given below shows the ratio of production to sales of t...
Text Solution
|
- The line chart given below shows the ratio of poduction to sales of tw...
Text Solution
|
- The line chart given below shows the ratio of poduction to sales of tw...
Text Solution
|