


Similar Questions
Explore conceptually related problems
Recommended Questions
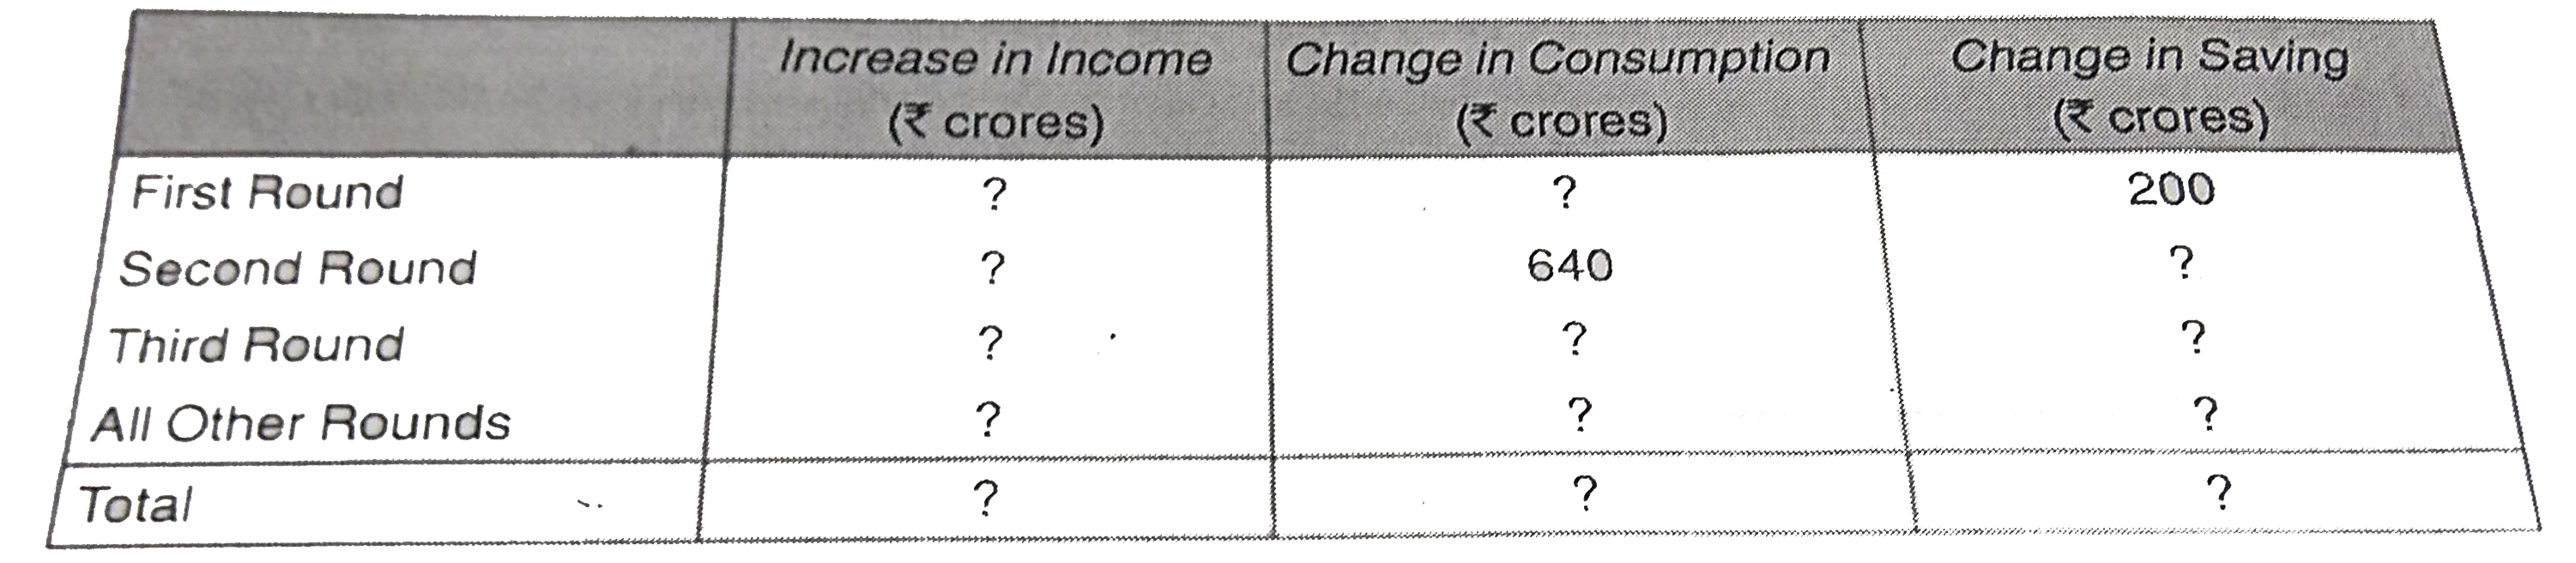
- The follwing table illustrates the multiplier process after making an ...
Text Solution
|
- हैलोऐल्केन की किसी प्रतिस्थापन अभिक्रिया की क्रियाविधि लिखिए तथा क्लो...
Text Solution
|
- फ्रेऑन क्या है ? फ्रेऑन बनाने की विधि , गुण एवं उपयोग बताइए।
Text Solution
|
- पोटेशियम परमैगनेट बनाने की विधि, दो ऑक्सीकरण गुण एवं दो उपयोग बताइए।
Text Solution
|
- क्लोरीन के निर्माण की डिकन विधि की रासायनिक समीकरण लिखिए ।
Text Solution
|
- भौमिक समय सारणी क्या है? कौन-सा महाकल्प सरीसृप युग कहलाता है और क्यों?
Text Solution
|
- निम्नलिखित समाकलों के मान ज्ञात कीजिए- intxdx
Text Solution
|
- निम्नलिखित समाकलों के मान ज्ञात कीजिए- int2^(x)dx
Text Solution
|
- निम्नलिखित समाकलों के मान ज्ञात कीजिए- intcos^(3)xdx
Text Solution
|