


Similar Questions
Explore conceptually related problems
Recommended Questions
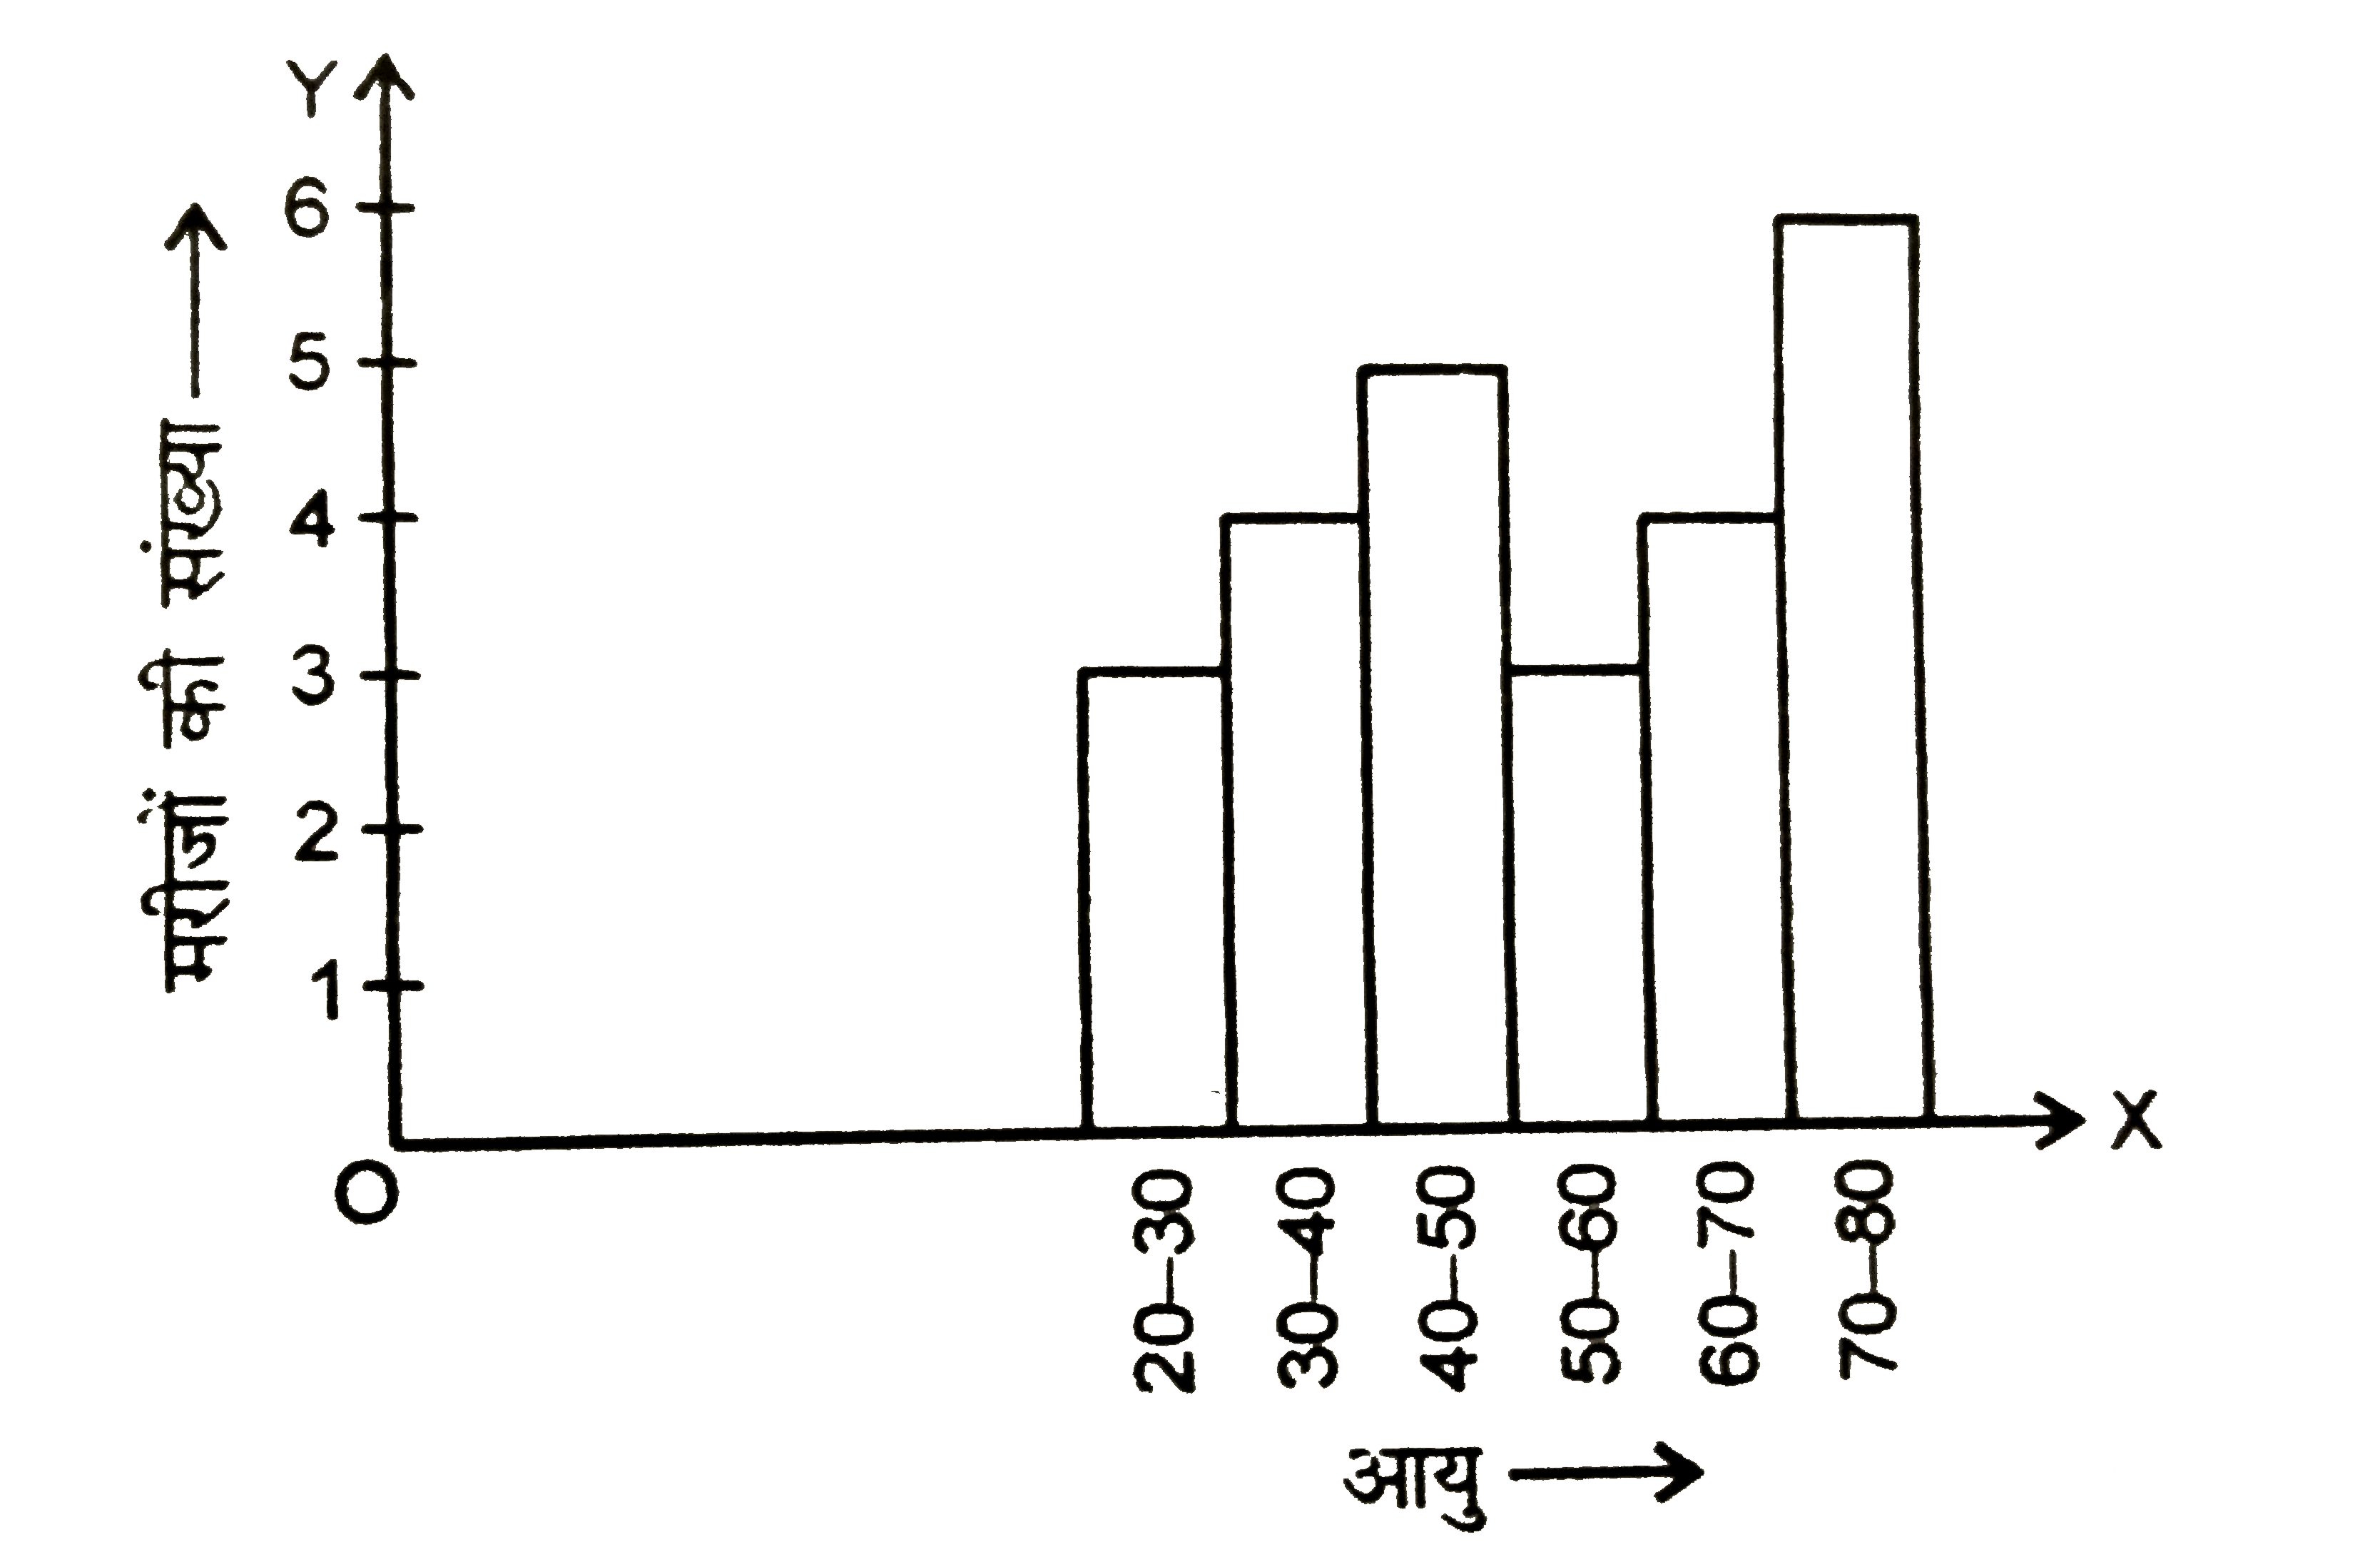
- दिए गए चित्र में किसी स्वास्थ केंद्र में किसी दिन आए मरीजों की संख्या ...
Text Solution
|
- Determine the point of symmetry of a regular hexagon. <img src="htt...
Text Solution
|
- Match the following Column A to Column B
Text Solution
|
- Match the following Column A to Column B
Text Solution
|
- Match the following Column A to Column B
Text Solution
|
- The inequation represented by the graph given below is : <img src="htt...
Text Solution
|
- The inequation that best describes the graph given below is <img src=...
Text Solution
|
- The inequation that best describes the following graph is <img src="h...
Text Solution
|
- दिये गये चित्र में स्पर्श रेखाओ की संख्या है -
Text Solution
|