


Similar Questions
Explore conceptually related problems
Recommended Questions
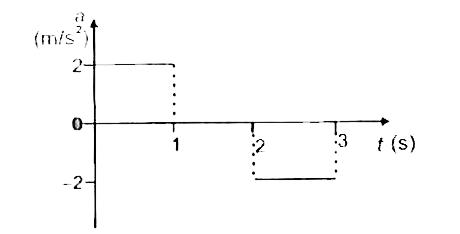
- Acceleration - time graph for a particle is given in figure. If it sta...
Text Solution
|
- The x-t graph of a particle undergoing simple harmonic motion is shown...
Text Solution
|
- If the distance s travelled by a particle in time t is s=a sin t +b co...
Text Solution
|
- A graph of acceleration versus time of a particle starting from rest a...
Text Solution
|
- The position - time graph for a particle moving along a straight line ...
Text Solution
|
- Acceleration - time graph for a particle is given in figure. If it sta...
Text Solution
|
- The speed verses time graph for a particle is shown in the figure. The...
Text Solution
|
- The distance s feet travelled by a particle in time t second is given ...
Text Solution
|
- किसी निश्चित दिशा में गतिमान किसी कण के चाल-समय ग्राफ को चित्र में दर्...
Text Solution
|