A
B
C
D
Text Solution
Verified by Experts
The correct Answer is:


Topper's Solved these Questions
THE FIRST LAW OF THERMODYNAMICS
RESNICK AND HALLIDAY|Exercise PRACTICE QUESTIONS ( LINKED COMPREHENSION )|15 VideosTHE FIRST LAW OF THERMODYNAMICS
RESNICK AND HALLIDAY|Exercise PRACTICE QUESTIONS ( INTEGER TYPE )|3 VideosTHE FIRST LAW OF THERMODYNAMICS
RESNICK AND HALLIDAY|Exercise PRACTICE QUESTIONS ( SINGLE CORRECT CHOICE TYPE )|48 VideosTEMPERATURE, ZEROTH LAW OF THERMODYNAMICS AND THERMAL EXPANSION
RESNICK AND HALLIDAY|Exercise PRACTICE QUETIONS (Integer Type)|4 VideosTHE KINETIC THEORY OF GASES
RESNICK AND HALLIDAY|Exercise PRACTICE QUESTIONS|72 Videos
Similar Questions
Explore conceptually related problems
RESNICK AND HALLIDAY-THE FIRST LAW OF THERMODYNAMICS-PRACTICE QUESTIONS ( MORE THAN ONE CORRECT CHOICE TYPE )
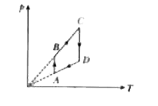
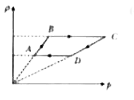
- Pressure temperature (p-1) graph of n moles of an ideal gas is shown i...
Text Solution
|
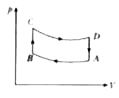
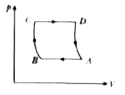
- A gas may expand either adiabatically or isothermally. A number of p-V...
Text Solution
|
- Which of the following is true in case of isothermal changes?
Text Solution
|
- For an ideal gas,
Text Solution
|
- A system undergoes a cyclic process in which it absorbs Q(1) heat and ...
Text Solution
|
- A steel drill making 180 rpm is used to drill a hole in a block of ste...
Text Solution
|
- An ideal gas is heated from termperature T(1) to T(2) under various co...
Text Solution
|
- The internal energy of a system remains constant when it undergoes
Text Solution
|
- An ideal gas is taken from the state A (P, V) to the state B (P//2, 2 ...
Text Solution
|