


Similar Questions
Explore conceptually related problems
Recommended Questions
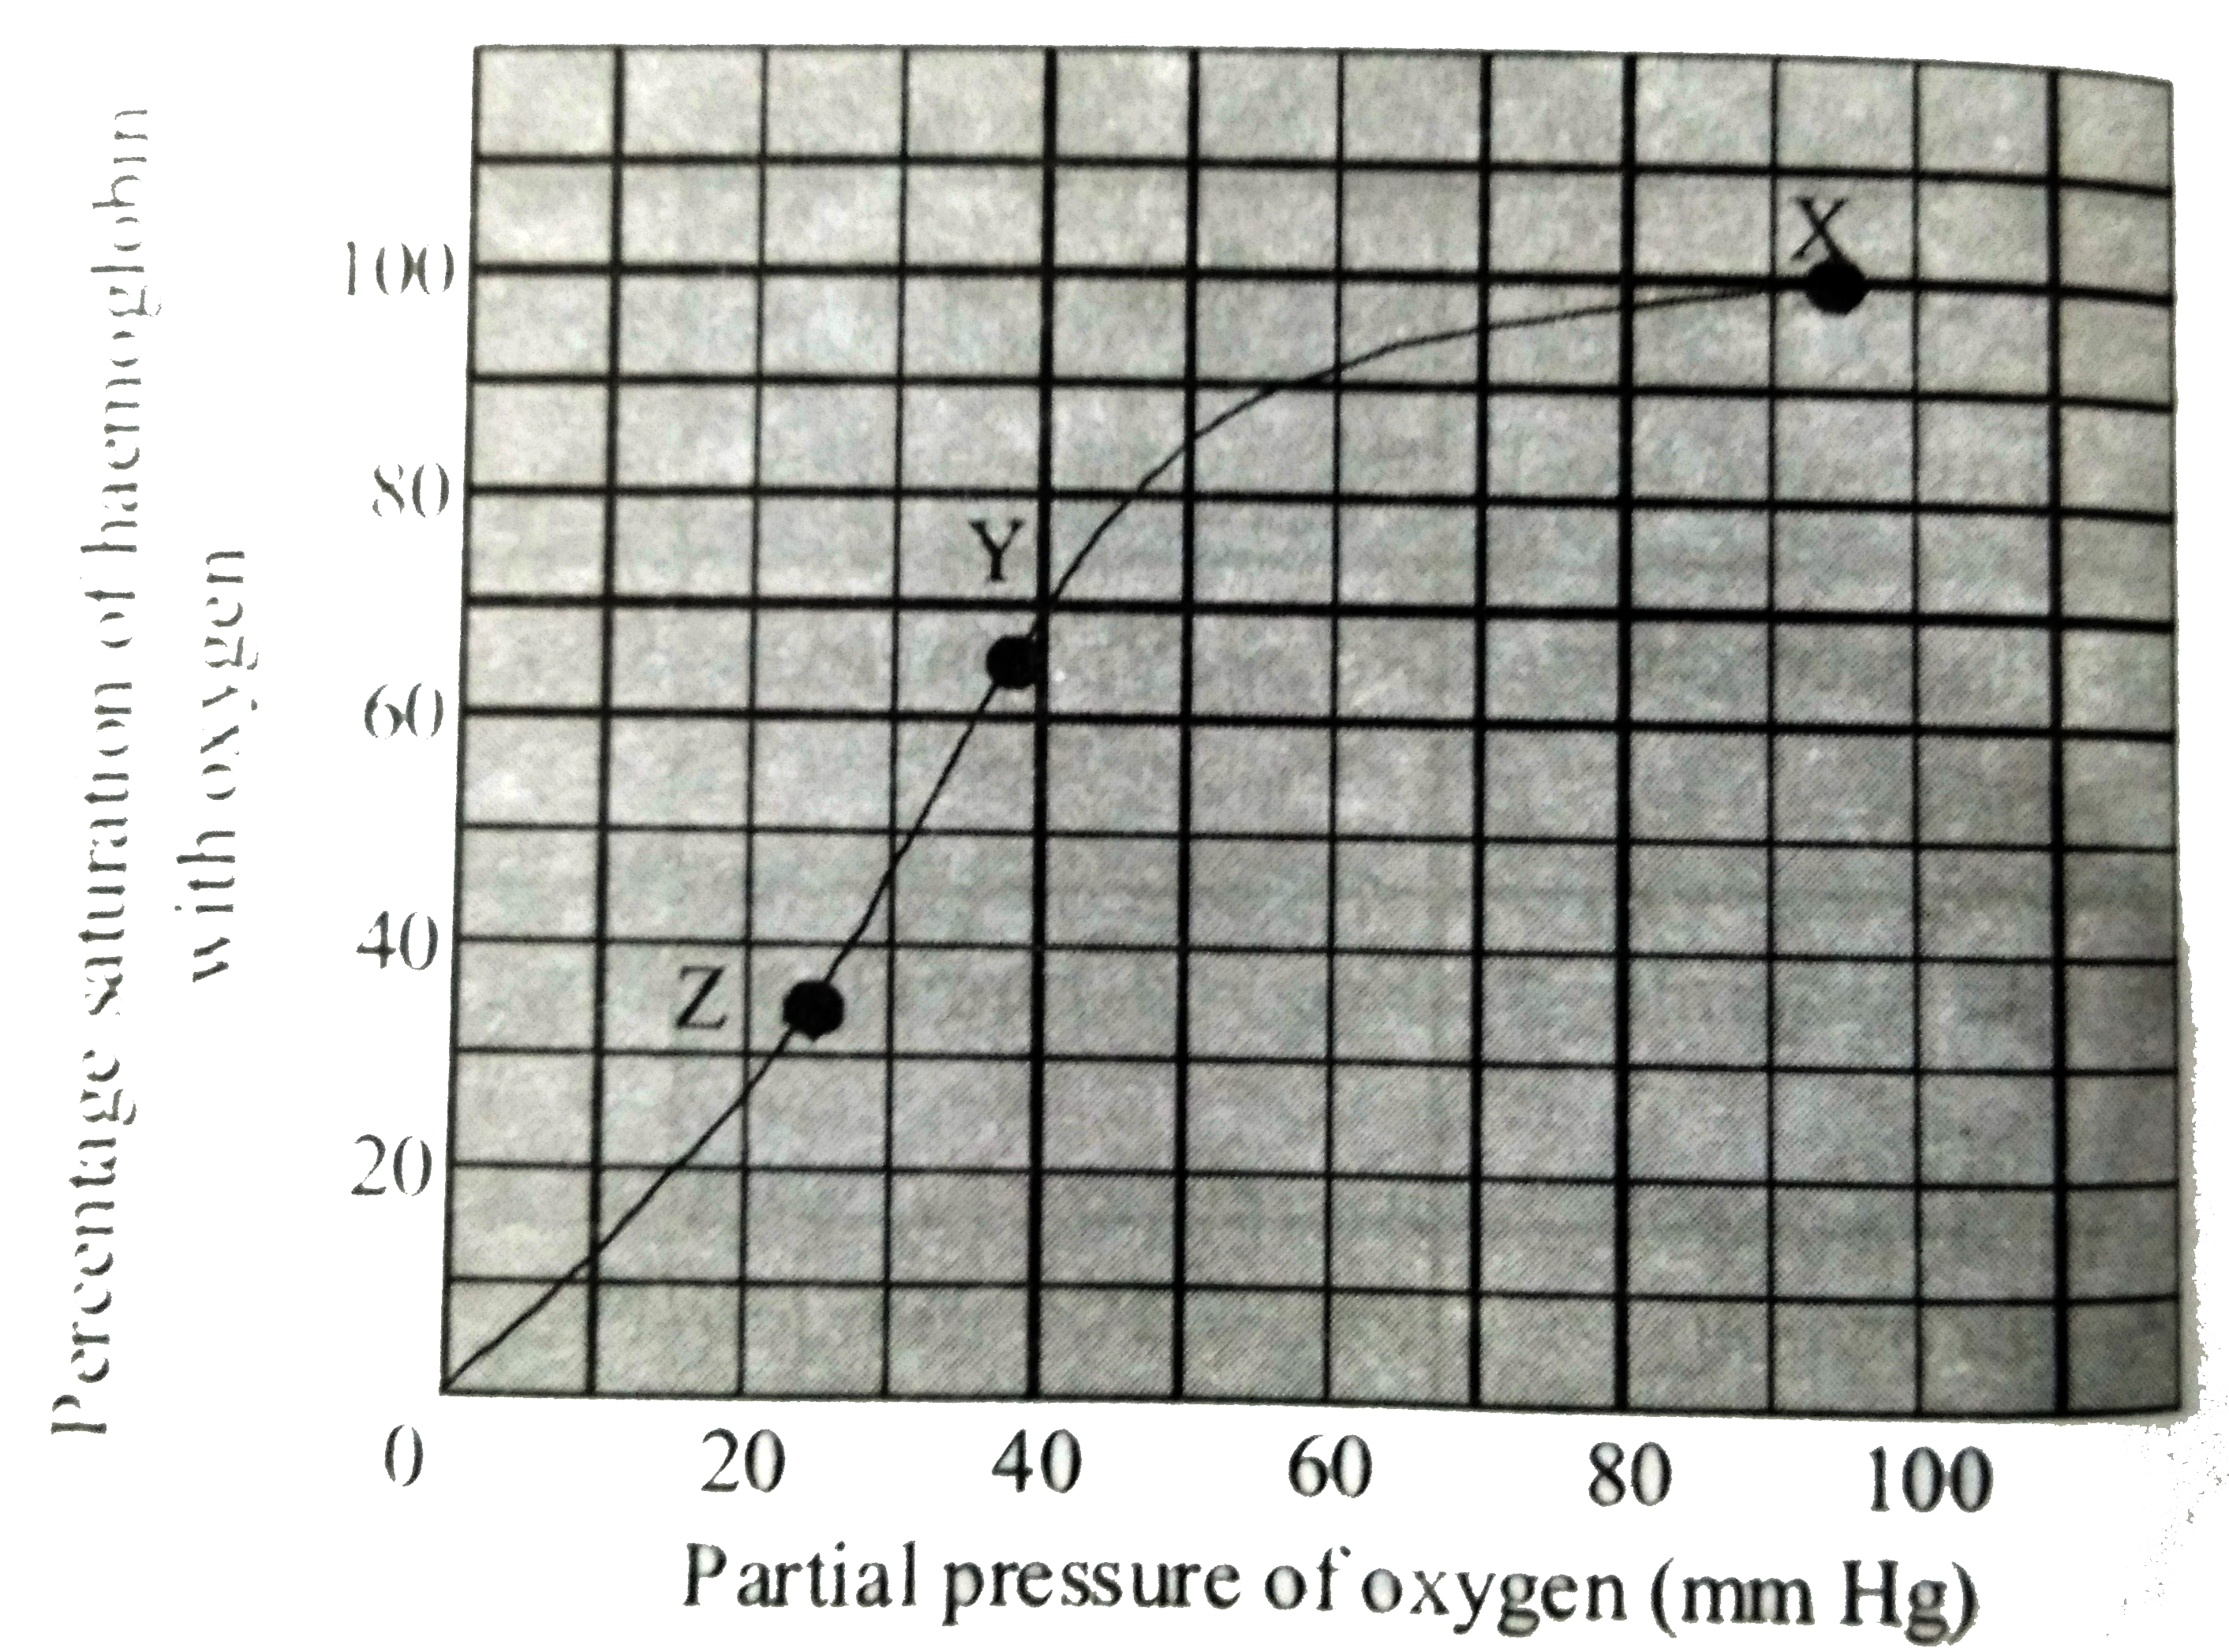
- Given below graphs an oxygen dissociation curve :- Where in the b...
Text Solution
|
- The given graph shows an oxygen dissociation curve for haemoglobin. Wh...
Text Solution
|
- Increased body temperature makes oxygen haemoglobin dissociation curve...
Text Solution
|
- Given below graphs an oxygen dissociation curve :- Where in the body w...
Text Solution
|
- Oxygen dissociation curve of haemoglobin is
Text Solution
|
- The given graph shows an oxygen dissociation curve for haemoglobin. Wh...
Text Solution
|
- The percentage of haemoglobin saturated with oxygen will increase if t...
Text Solution
|
- The accompanying graph depicts the % saturation of vertebrate haemoglo...
Text Solution
|
- Oxygen saturation curve of haemoglobin molecule is show in the graph ...
Text Solution
|