Text Solution
Verified by Experts


Topper's Solved these Questions
ORGANISMS AND POPULATIONS
MODERN PUBLICATION|Exercise REVISION EXERCISES (III. SHORT ANSWER TYPE - I QUESTIONS) (B. QUESTIONS FROM CBSE EXAMINATIONS)|18 VideosORGANISMS AND POPULATIONS
MODERN PUBLICATION|Exercise REVISION EXERCISES (IV. SHORT ANSWER TYPE - II QUESTIONS) (A. QUESTIONS FROM STATE BOARD EXAMINATIONS)|27 VideosORGANISMS AND POPULATIONS
MODERN PUBLICATION|Exercise REVISION EXERCISES (II. VERY SHORT ANSWER QUESTIONS) (B. QUESTIONS FROM CBSE EXAMINATIONS)|13 VideosMOLECULAR BASIS OF INHERITANCE
MODERN PUBLICATION|Exercise CHAPTER PRACTICE TEST (Section - E)|1 VideosPRINCIPLES OF INHERITANCE AND VARIATION
MODERN PUBLICATION|Exercise CHAPTER PRACTICE TEST section-e(Long answer type question)|1 Videos
Similar Questions
Explore conceptually related problems
MODERN PUBLICATION-ORGANISMS AND POPULATIONS -REVISION EXERCISES (III. SHORT ANSWER TYPE - I QUESTIONS) (A. QUESTIONS FROM STATE BOARD EXAMINATIONS)
- Define the following terms: (a) Parasitism (b) Aestivation (w.r.t to...
Text Solution
|
- Define the following terms. (a) Mimicry (b) Hibernation (c) Habitat.
Text Solution
|
- Define the following terms: (a) Symbiosis (b) Pheromones (c) Epiphyt...
Text Solution
|
- Define predation. Give one example.
Text Solution
|
- Define parasitism. Give one example.
Text Solution
|
- Name any one symbiotic nitrogen fixing bacteria. How does help in nitr...
Text Solution
|
- Define symbosis. Give two examples.
Text Solution
|
- Differentiate allelopathy and antibiosis.
Text Solution
|
- What are the factors of population growth?
Text Solution
|
- "The Indian Government took up many serious measures to check the cont...
Text Solution
|
- Explain why very small animals are rarely found in polar region.
Text Solution
|
- What are the various adaptations of parasites ?
Text Solution
|
- Brood parasite is
Text Solution
|
- What is amensalism and commensalism?
Text Solution
|
- Differentiate between Hibernation and Aestivation.
Text Solution
|
- A prey develops defence against a predator, Justify the statement with...
Text Solution
|
- Mention any two mechanisms how human body compensates low oxygen avai...
Text Solution
|
- Match the column (A) and (B) :
Text Solution
|
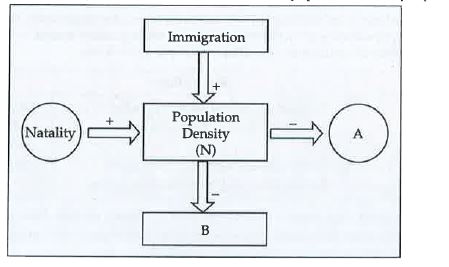
- Observe flow chart given below: (a) Name the processes represented a...
Text Solution
|
- What is age pyramid ? Draw the expanding age pyramid and label its par...
Text Solution
|