A
B
C
D
Text Solution
Verified by Experts
The correct Answer is:


Topper's Solved these Questions
ORGANISMS AND POPULATIONS
MODERN PUBLICATION|Exercise COMPETITION FILE (OBJECTIVE TYPE QUESTIONS)(B. MATCHING TYPE QUESTIONS: )|4 VideosORGANISMS AND POPULATIONS
MODERN PUBLICATION|Exercise COMPETITION FILE (OBJECTIVE TYPE QUESTIONS)(C. ASSERTION - REASON TYPE QUESTIONS: )|10 VideosORGANISMS AND POPULATIONS
MODERN PUBLICATION|Exercise REVISION EXERCISES (VI. LONG ANSWER TYPE QUESTIONS)(B. QUESTIONS FROM CBSE EXAMINATIONS)|8 VideosMOLECULAR BASIS OF INHERITANCE
MODERN PUBLICATION|Exercise CHAPTER PRACTICE TEST (Section - E)|1 VideosPRINCIPLES OF INHERITANCE AND VARIATION
MODERN PUBLICATION|Exercise CHAPTER PRACTICE TEST section-e(Long answer type question)|1 Videos
Similar Questions
Explore conceptually related problems
MODERN PUBLICATION-ORGANISMS AND POPULATIONS -COMPETITION FILE (OBJECTIVE TYPE QUESTIONS)(A. MULTIPLE CHOICE QUESTIONS)
- Edaphology is
Text Solution
|
- Population density of terrestrial organisms is measured in terms of in...
Text Solution
|
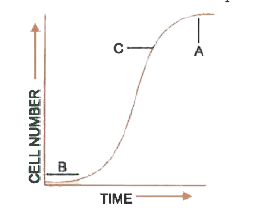
- Given below is a graph drawn on the parameters of growth versus time A...
Text Solution
|
- A(0) layer is rich in
Text Solution
|
- Study of ecology of population is called
Text Solution
|
- Psammophytes are plants that grow where soil is
Text Solution
|
- Species can be idientified on the basis of
Text Solution
|
- Ecological study of single species is called :
Text Solution
|
- Nicotiana sylvestris flowers only during long days and N.tobacum flowe...
Text Solution
|
- What is the keystone species?
Text Solution
|
- Which are true about the following statements about kangaroo rats (a...
Text Solution
|
- Azolla enriches rice fields with nitrogen due to its association with...
Text Solution
|
- Maximum growth rate occur in
Text Solution
|
- The presence of diversity at the junction of territories of two differ...
Text Solution
|
- July 11 is observed as
Text Solution
|
- Study of ecology of population is called
Text Solution
|
- The amount of fresh water of the earth frozen as polar or glacial ice ...
Text Solution
|
- The change in population size at a given time interval t , is given by...
Text Solution
|
- The plant of this group are adapted to live partly in water and partly...
Text Solution
|
- Which one represents a mutualistic association of a fungus with roots...
Text Solution
|