A
B
C
D
Text Solution
Verified by Experts
The correct Answer is:


Topper's Solved these Questions
ORGANISMS AND POPULATIONS
MODERN PUBLICATION|Exercise COMPETITION FILE (OBJECTIVE TYPE QUESTIONS)(B. MATCHING TYPE QUESTIONS: )|4 VideosORGANISMS AND POPULATIONS
MODERN PUBLICATION|Exercise COMPETITION FILE (OBJECTIVE TYPE QUESTIONS)(C. ASSERTION - REASON TYPE QUESTIONS: )|10 VideosORGANISMS AND POPULATIONS
MODERN PUBLICATION|Exercise REVISION EXERCISES (VI. LONG ANSWER TYPE QUESTIONS)(B. QUESTIONS FROM CBSE EXAMINATIONS)|8 VideosMOLECULAR BASIS OF INHERITANCE
MODERN PUBLICATION|Exercise CHAPTER PRACTICE TEST (Section - E)|1 VideosPRINCIPLES OF INHERITANCE AND VARIATION
MODERN PUBLICATION|Exercise CHAPTER PRACTICE TEST section-e(Long answer type question)|1 Videos
Similar Questions
Explore conceptually related problems
MODERN PUBLICATION-ORGANISMS AND POPULATIONS -COMPETITION FILE (OBJECTIVE TYPE QUESTIONS)(A. MULTIPLE CHOICE QUESTIONS)
- Mycorrhiza promotes plant growth by
Text Solution
|
- Most animals are tree dwellers in a
Text Solution
|
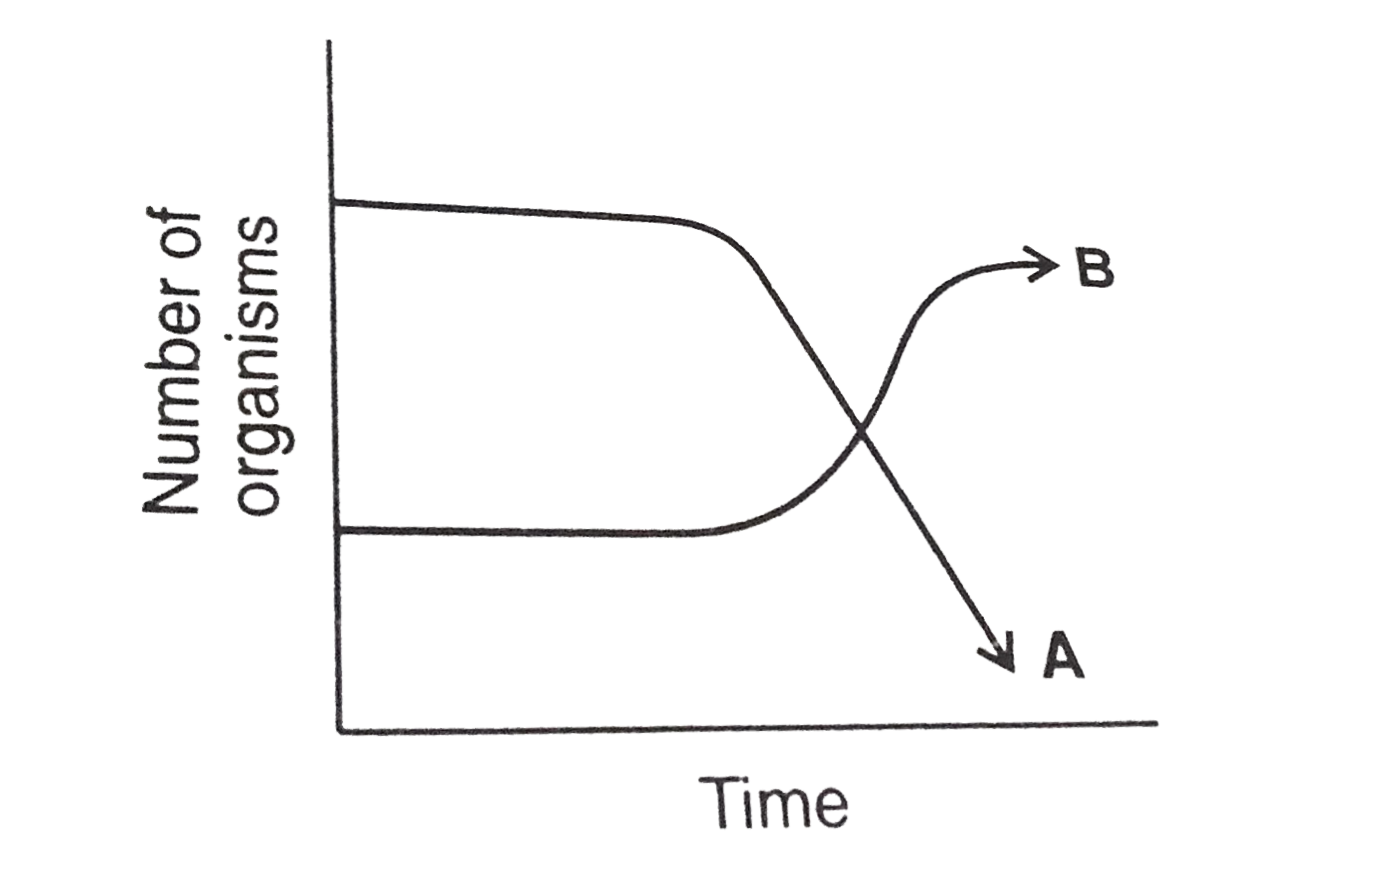
- The following graph depicts changes in two populations (A and B) of he...
Text Solution
|
- In which of the following interaction both partners are adversely affe...
Text Solution
|
- The figure given below is a diagrammatic representation of response of...
Text Solution
|
- Allen's rule applies to:
Text Solution
|
- Troublesome American water weed found in Inida is
Text Solution
|
- The characters such as pointed elongated snout, strong and stout forel...
Text Solution
|
- A cuckoo laying eggs in the nest of other species of birds is an examp...
Text Solution
|
- One of the following pair of animals is an example of commensalism :
Text Solution
|
- Father of Ecology in india
Text Solution
|
- Interaction where one species is benefited and other is neither nor ha...
Text Solution
|
- Which of the following are the causes of population growth?
Text Solution
|
- Which of the following is a xerophyte:
Text Solution
|
- Which of the following is an abiotic components of the ecosystem?
Text Solution
|
- Who coined the term ecology ?
Text Solution
|
- Shade loving plants are called :
Text Solution
|
- Which of the following is correct for r-selected species ?
Text Solution
|
- If '+' sign is assigned to benefited interaction '-' sign to detriment...
Text Solution
|
- Which of the following is correctly matched?
Text Solution
|