


Similar Questions
Explore conceptually related problems
Recommended Questions
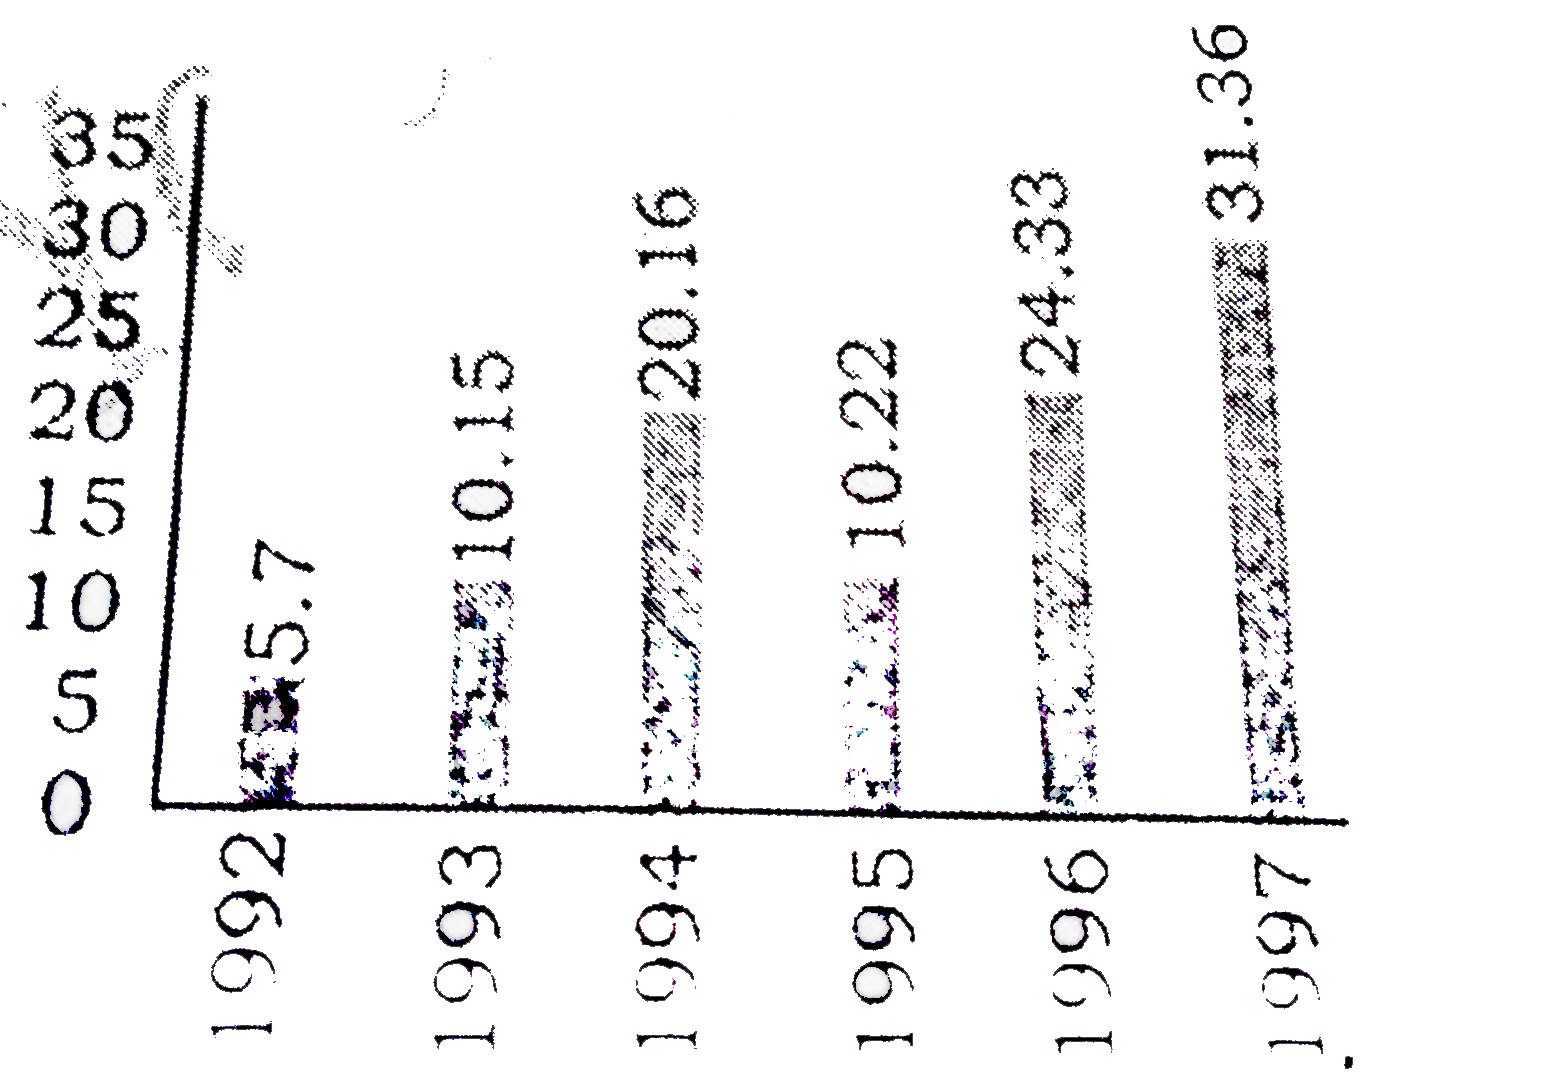
- बार हाफ में समस्त विश्व से भारत में विदेशी प्रत्यक्ष निवेश (एफ़ डी आई )...
Text Solution
|
- Study the bar diagram and answer these questions. नीचे दिये गया बार डा...
Text Solution
|
- गलता लोहा' पाठ में त्रिलोक सिंह को किस रूप में चित्रित किया गया है?
Text Solution
|
- 'भारत-माता पाठ मूलतः किस भाषा में लिखा गया ?
Text Solution
|
- बाल्मीकि रामायण में किस भाषा का प्रयोग किया गया है?
Text Solution
|
- निम्नलिखित में से विदेशी शब्द नहीं है
Text Solution
|
- निम्नांकित में विदेशी शब्द है
Text Solution
|
- निम्न में से विकल्प में 'कम' शब्द का विशेषणीय प्रयोग किया गया है?
Text Solution
|
- In India, which type of forest among the following occur pies the larg...
Text Solution
|