A
B
C
D
Text Solution
Verified by Experts
The correct Answer is:


Similar Questions
Explore conceptually related problems
Recommended Questions
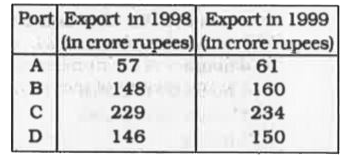
- The table given below depicts the export of a commodity through four p...
Text Solution
|
- Determine the point of symmetry of a regular hexagon. <img src="htt...
Text Solution
|
- Match the following Column A to Column B
Text Solution
|
- Match the following Column A to Column B
Text Solution
|
- Match the following Column A to Column B
Text Solution
|
- Find the area of figure given below.
Text Solution
|
- Find the perimeter of the figure given below.
Text Solution
|
- Find the area of the figure given below.
Text Solution
|
- The area of the shaded part in the figure given below is .
Text Solution
|