A
B
C
D
Text Solution
Verified by Experts
The correct Answer is:


Recommended Questions
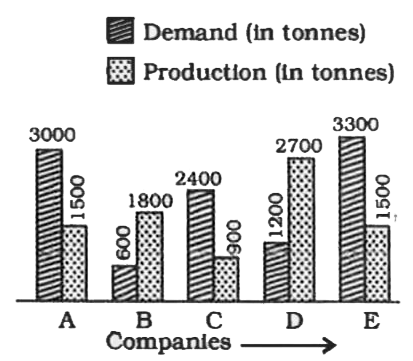
- The following graph shows the demand and production of cotton by 5 com...
Text Solution
|
- The inequation represented by the graph given below is : <img src="htt...
Text Solution
|
- The inequation that best describes the following graph is <img src="h...
Text Solution
|
- The following graph shows the demand and production of cotton by 5 com...
Text Solution
|
- The following graph shows the demand and production of cotton by 5 com...
Text Solution
|
- The following graph shows the demand and production of cotton by 5 com...
Text Solution
|
- The following graph shows the demand and production of cotton by 5 com...
Text Solution
|
- Identify A,B,C and D,E <img src="https://d10lpgp6xz60nq.cloudfront.net...
Text Solution
|
- निम्नलिखित चार्ट में 5 कंपनियों A,B,C,D एवं E की मांग और उनके उत्पादन ...
Text Solution
|