A
B
C
D
Text Solution
Verified by Experts
The correct Answer is:


Similar Questions
Explore conceptually related problems
Recommended Questions
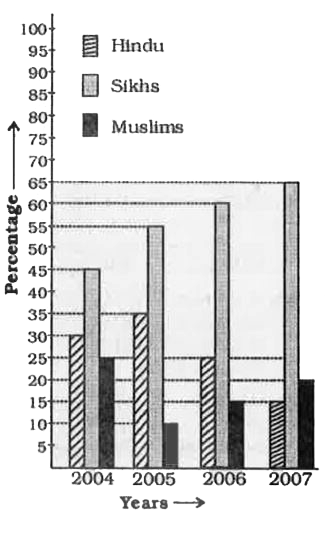
- The following bar diagram shows the percentage of Hindus, Sikhs and Mu...
Text Solution
|
- The following bar diagram shows the percentage of Hindus, Sikhs and Mu...
Text Solution
|
- The following bar diagram shows the percentage of Hindus, Sikhs and Mu...
Text Solution
|
- The following bar diagram shows the percentage of Hindus, Sikhs and Mu...
Text Solution
|
- The following bar diagram shows the percentage of Hindus, Sikhs and Mu...
Text Solution
|
- The following bar diagram shows the percentage of Hindus, Sikhs and Mu...
Text Solution
|
- The following bar diagram shows the percentage of Hindus, Sikhs and Mu...
Text Solution
|
- The following graph shows the percentage of population of Hindus, Sikh...
Text Solution
|
- The following graph shows the percentage of population of Hindus, Sikh...
Text Solution
|