Home
Class 12
PHYSICS
Figure shows position-time graph of two ...

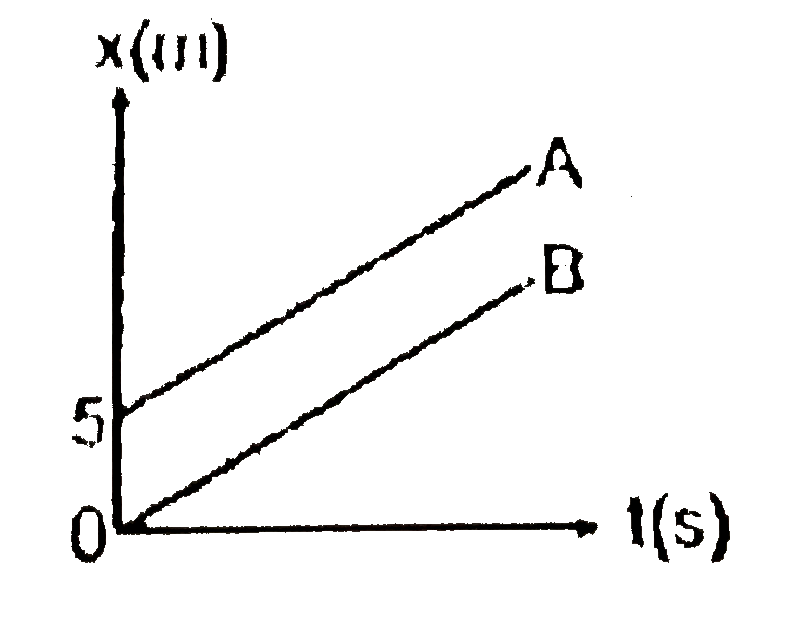
Figure shows position-time graph of two cars A and B.

Promotional Banner

Similar Questions

Explore conceptually related problems

The figure shows position time graph of two riders C and D. Based on the information represented by the graph, answer the following questions. At t = 0 s

The figure shows position time graph of two riders C and D. Based on the information represented by the graph, answer the following questions. At t = 0 s

The figure shows position time graph of two riders C and D. Based on the information represented by the graph, answer the following questions. At t = 0 s

The figure shows position time graph of two riders C and D. Based on the information represented by the graph, answer the following questions. At t = 0 s

The figure shows position time graph of two riders C and D. Based on the information represented by the graph, answer the following questions. At t = 10 s

The figure shows position time graph of two riders C and D. Based on the information represented by the graph, answer the following questions. At t = 10 s

The figure shows position time graph of two riders C and D. Based on the information represented by the graph, answer the following questions. At t = 0 s

The figure shows position time graph of two riders C and D. Based on the information represented by the graph, answer the following questions. At t = 0 s

Figure shows the position-time graphs of three car A, B and C. On the basis of the graphs, answer the following questions : What is the relative velocity of car B with respect to car C ?

Figure shows the position-time graphs of three car A, B and C. On the basis of the graphs, answer the following questions : What is the relative velocity of car C with respect to car A ?