


Similar Questions
Explore conceptually related problems
Recommended Questions
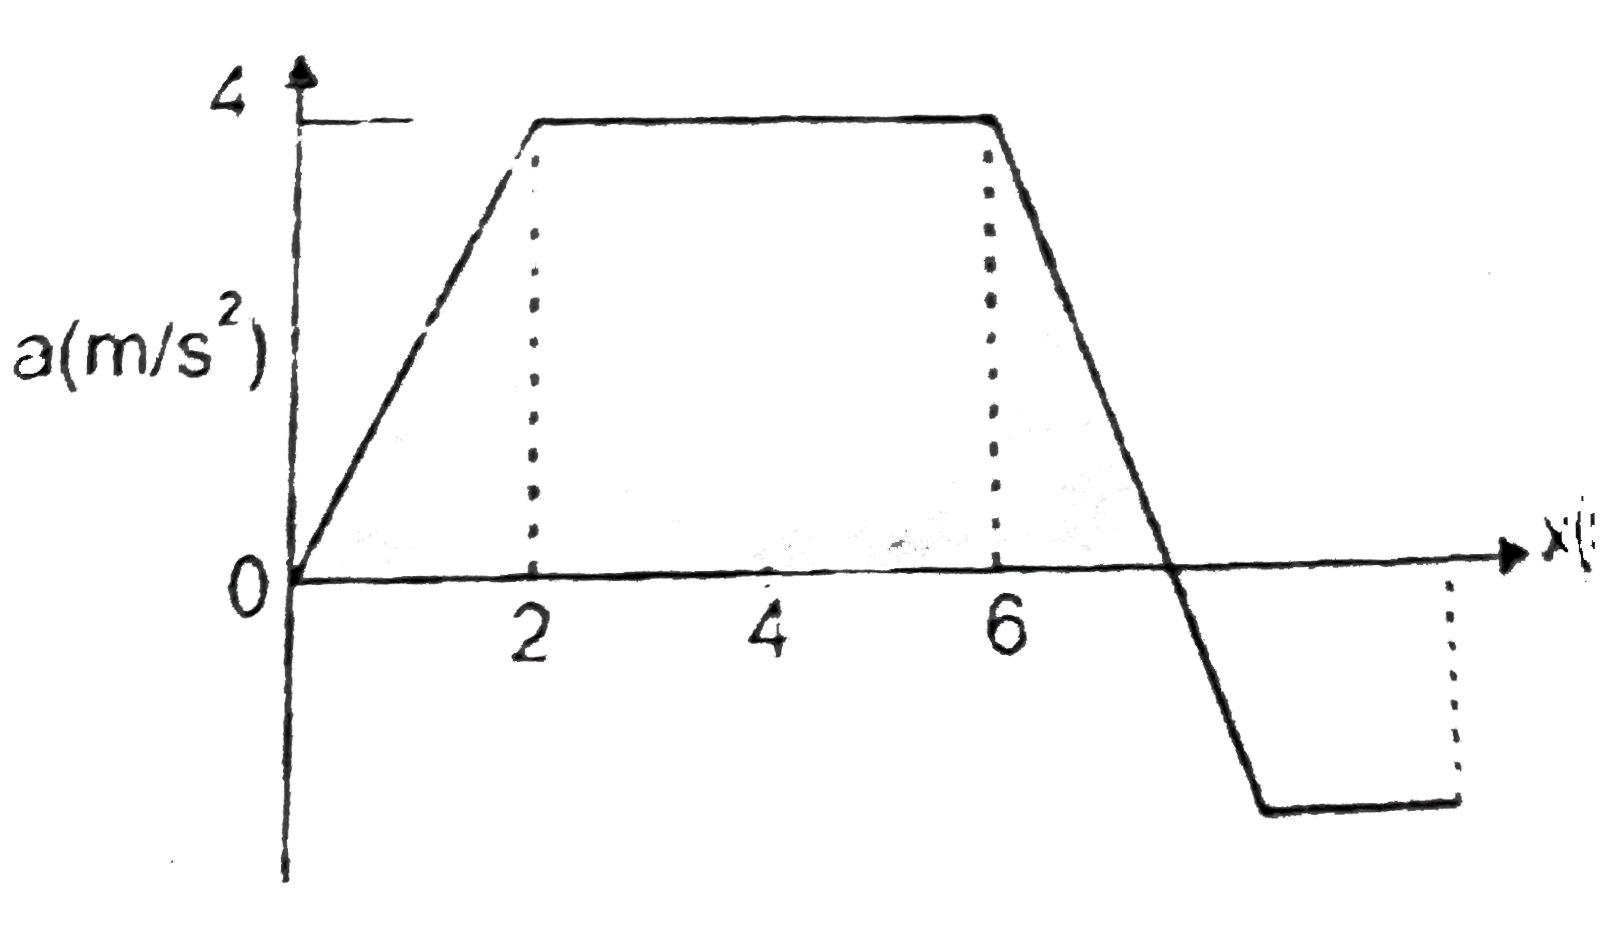
- Graphs shows the acceleration of a 3 kg particle as an applied force m...
Text Solution
|
- Graph shows the acceleration of a 3kg particles as an applied force mo...
Text Solution
|
- Graphs shows the acceleration of a 3 kg particle as an applied force m...
Text Solution
|
- The given graph represents the total force in x direction being applie...
Text Solution
|
- A particle is displaced from x=-6 m to x=+6 m A force F acting on the ...
Text Solution
|
- A particle starts from rest x = - 2.25 m and moves along the x - axis ...
Text Solution
|
- The rate of doing work by force acting on a particle moving along x-ax...
Text Solution
|
- 1 किग्रा द्रव्यमान का एक कण समय पर निर्भर (time dependent ) बल F = 6t ...
Text Solution
|
- चित्र में x-अक्ष पर चलते एक कण का विस्थापन समय के साथ बदलता हुआ दिखाया...
Text Solution
|