


Similar Questions
Explore conceptually related problems
Recommended Questions
- The temperatures versus time graph is shown in figure. Which of the su...
Text Solution
|
- In the above problem if heat is supplied at a constant rate of q= 10 c...
Text Solution
|
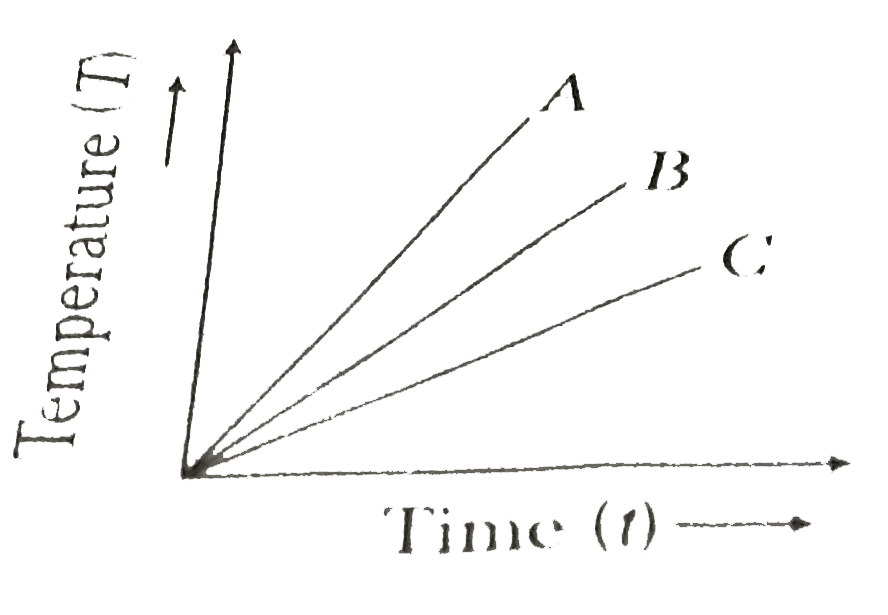
- Which of the substances A, B or C has the highest specific heat ? The ...
Text Solution
|
- A solid substance is at 30^(@)C . To this substance heat energy is sup...
Text Solution
|
- Equal masses of two liquids A and B contained in vessels of negligible...
Text Solution
|
- The temperatures versus time graph is shown in figure. Which of the su...
Text Solution
|
- A substance is in the solid from at 0^(@)C. The amount of heat added t...
Text Solution
|
- A substance is in the solid from at 0^(@)C . The amount of heat added ...
Text Solution
|
- Heat is supplied to a ice at a constant rate Temperature variation wit...
Text Solution
|