


Similar Questions
Explore conceptually related problems
Recommended Questions
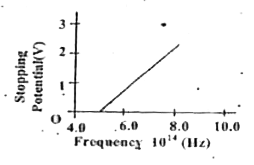
- The stopping potential vs frequency plot for a substance is shown in t...
Text Solution
|
- Figure is the plot of the stopping potential versus the frequency of t...
Text Solution
|
- The stopping potential as a function of the frequency of the incident ...
Text Solution
|
- The stopping potential (V(0)) versus frequency (v) plot of a substance...
Text Solution
|
- Light of frequency v is incident on a certain photoelectric substance ...
Text Solution
|
- The stopping potential as a function of frequency of incident radiatio...
Text Solution
|
- The stopping potential vs frequency plot for a substance is shown in t...
Text Solution
|
- Graph between stopping potential and frequency of light as shown find ...
Text Solution
|
- For photo senstive surface A and B graph of stopping potential versus ...
Text Solution
|