 .
.


Similar Questions
Explore conceptually related problems
Recommended Questions
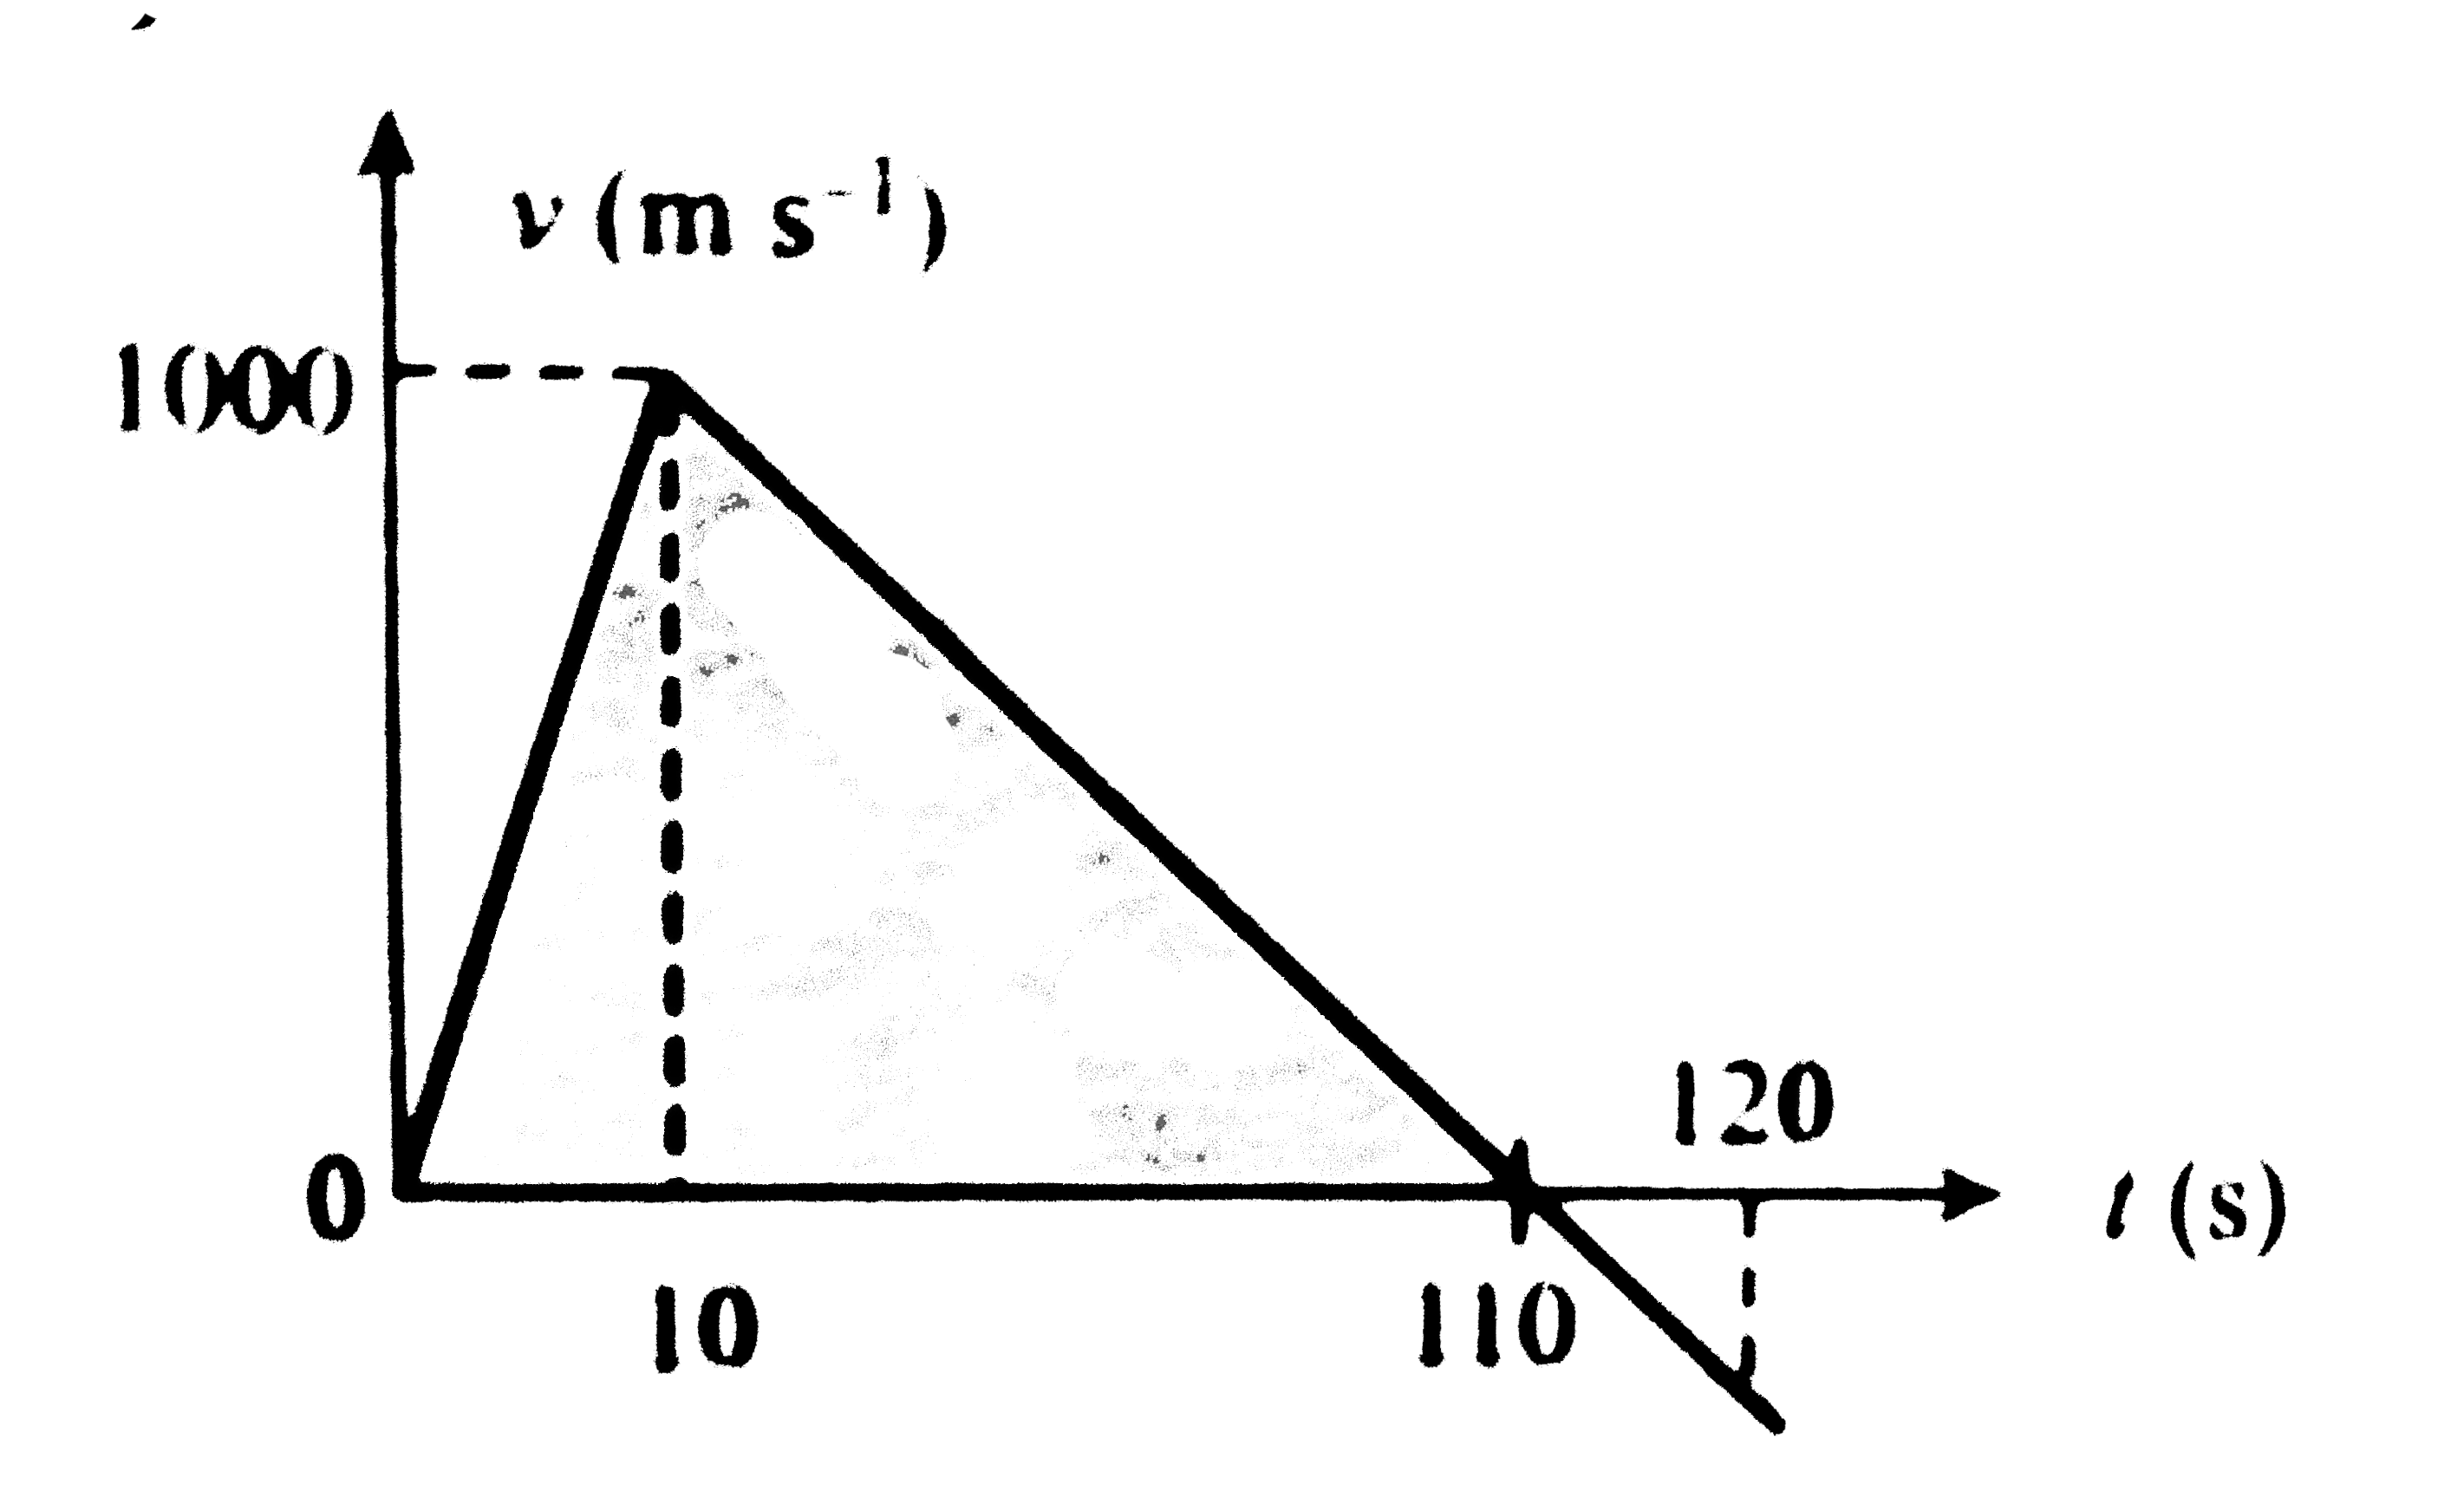
- The follwing graph shows the variation of velocity of a rocker with ti...
Text Solution
|
- The follwing graph shows the variation of velocity of a rocker with ti...
Text Solution
|
- The graph shown the variation of velocity of a rocket with time. Then,...
Text Solution
|
- A rocket is projected vertically upwards and its time velocity graph i...
Text Solution
|
- In the previous question, the height attained by the rocket before dec...
Text Solution
|
- A rocket is fired upwards. Its velocity versus time graph is shown in ...
Text Solution
|
- A rocket is fired upwards such that its engine takes 10 s to explods f...
Text Solution
|
- एक रॉकेट ऊपर की और इस प्रकार दागा जाता है की इसका इंजन पूर्णतया सक...
Text Solution
|
- A rocket is launched upward from the earth surface whose velocity time...
Text Solution
|