


Similar Questions
Explore conceptually related problems
Recommended Questions
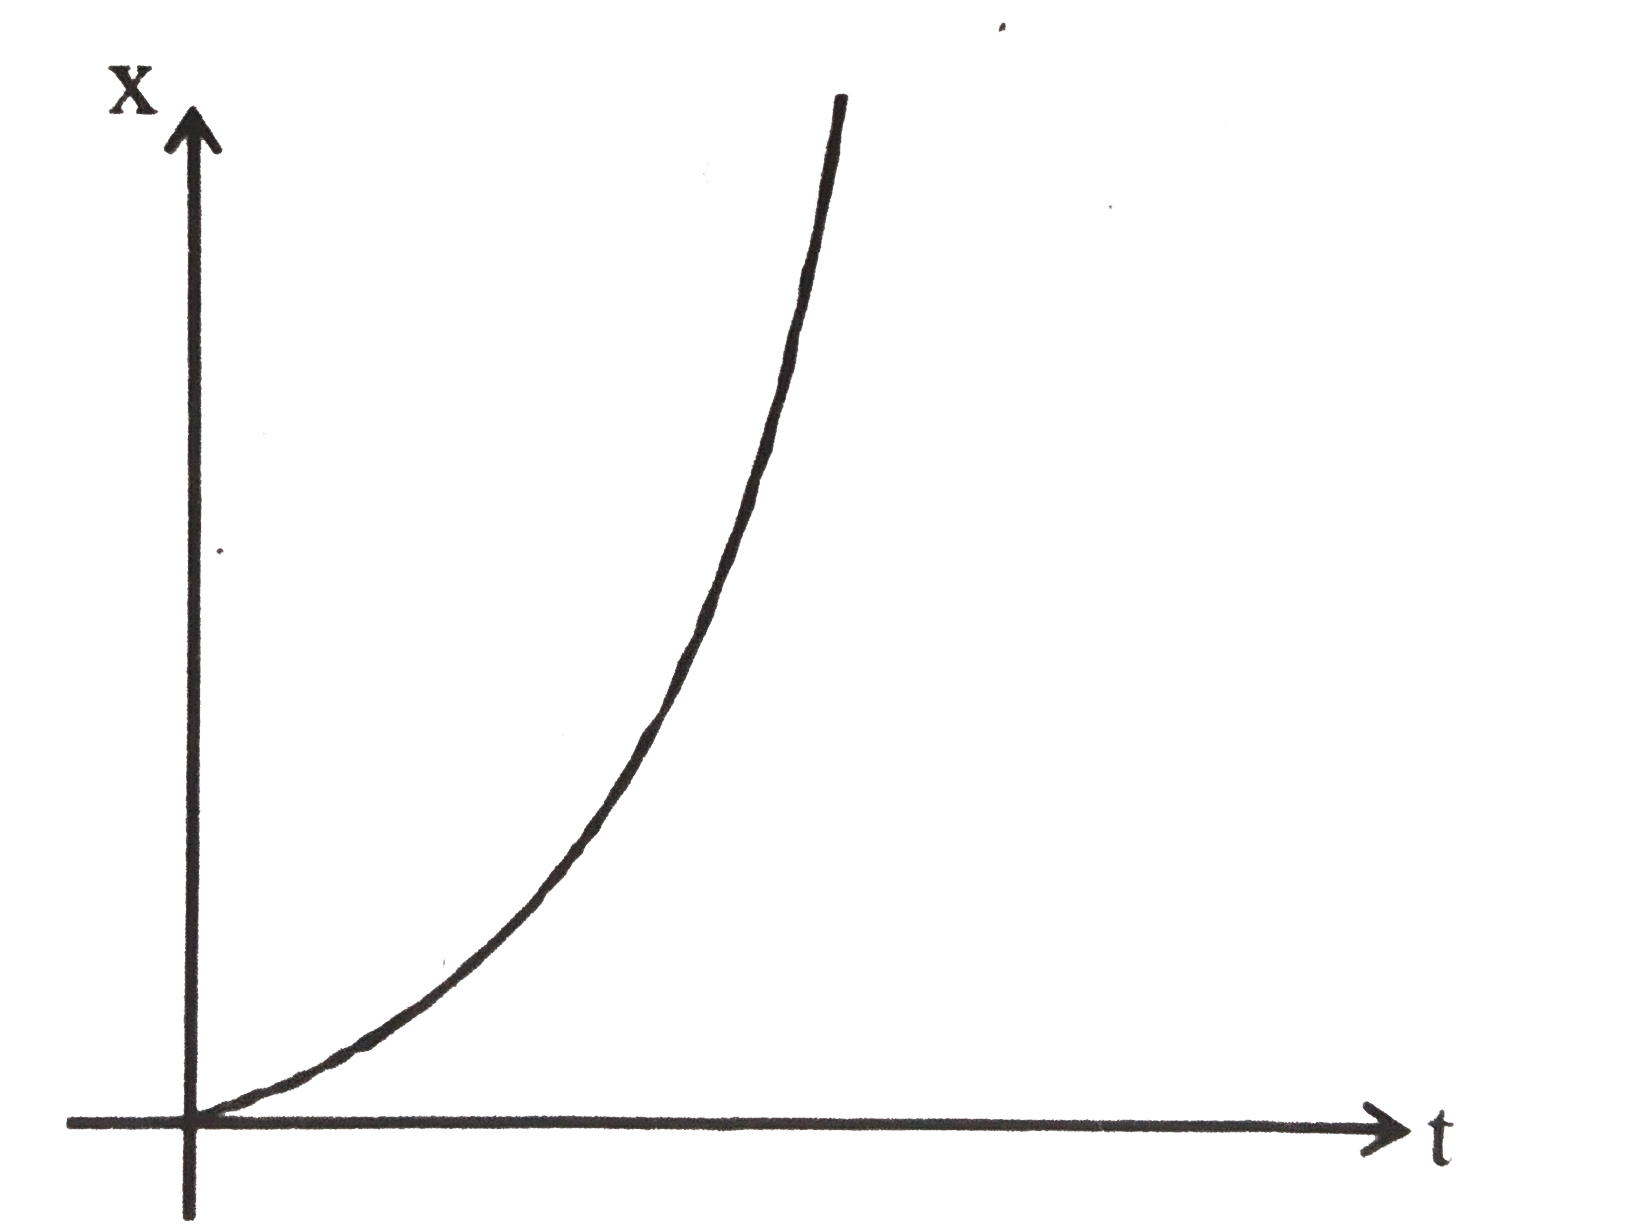
- The plot given above represents displacement 'x' of a particle with ti...
Text Solution
|
- The displacement x of a particle at time t along a straight line is gi...
Text Solution
|
- The plot given above represents displacement 'x' of a particle with ti...
Text Solution
|
- The plot given above represents the velocity of a particle (in mis) wi...
Text Solution
|
- The displacement (x)-time (t) graph given above approximately represen...
Text Solution
|
- The displacement of a particle performing a S.H.M. is given by x =12 "...
Text Solution
|
- The displacement of a particle at time t is x, where x=t^4-kt^3. IF th...
Text Solution
|
- In the above question, the displacement of particle at t = 1 sec and x...
Text Solution
|
- Given displacement of a particle executing SHM y(t)=A cos (omegat+phi)...
Text Solution
|