


Similar Questions
Explore conceptually related problems
Recommended Questions
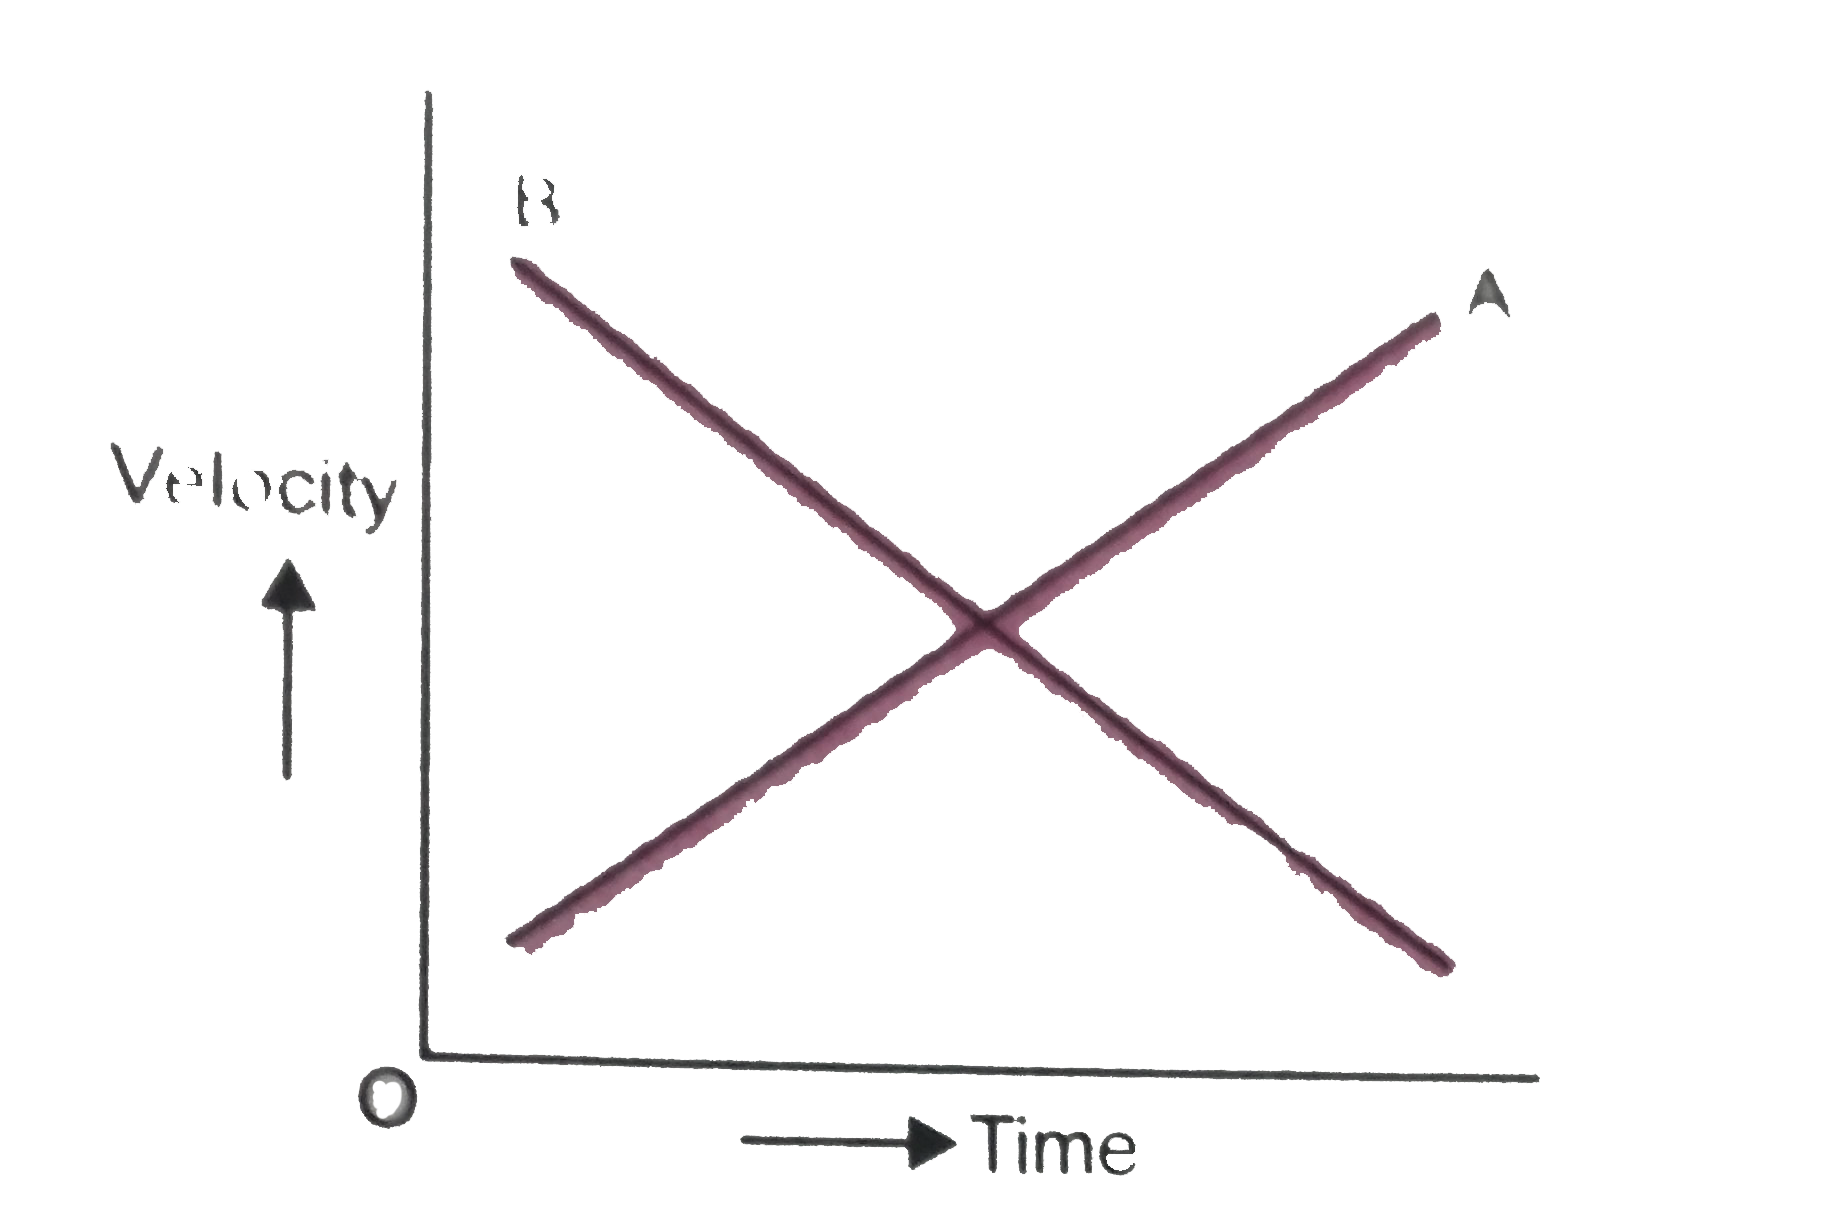
- (a) The velocity time graph of two bodies are shown in Figure. Slope o...
Text Solution
|
- The displacement-time graph of a body is shown in. . The velocity-...
Text Solution
|
- Assertion: The slope of displacement-time graph of a body moving with ...
Text Solution
|
- The slope of velocity time graph for body B is more than that for body...
Text Solution
|
- (a) The velocity time graph of two bodies are shown in Figure. Slope o...
Text Solution
|
- What do the slopes of distance-time and velocity-time graphs represen...
Text Solution
|
- निम्न ग्राफों का ढलान क्या प्रदर्शित करता है? (i)स्थिति-समय ग्राफ, (...
Text Solution
|
- कार्य-समय ग्राफ का ढलान क्या प्रदर्शित करता है?
Text Solution
|
- किसी वस्तु के चाल -समय ग्राफ का ढलान क्या प्रदर्शित करता है?
Text Solution
|