A
B
C
D
Text Solution
Verified by Experts
The correct Answer is:


Similar Questions
Explore conceptually related problems
Recommended Questions
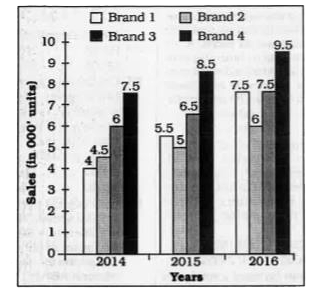
- The bar chart given below shows the sales (in '000 units) of 4 mobile ...
Text Solution
|
- The bar chart given below shows the sales (in '000 units) of 4 mobile ...
Text Solution
|
- The bar chart given below shows the sales (in '000 units) of 4 mobile ...
Text Solution
|
- The bar chart given below shows the sales (in '000 units) of 4 mobile ...
Text Solution
|
- The bar chart given below shows the sales (in '000 units) of 4 mobile ...
Text Solution
|
- The following graph shows the percentage increase in sales of branded ...
Text Solution
|
- The following graph shows the percentage increase in sales of branded ...
Text Solution
|
- The following graph shows the percentage increase in sales of branded ...
Text Solution
|
- The bar chart given below shows the sales (in '000 units) of 4 mobile ...
Text Solution
|