


NCERT-DATA HANDLING-EXERCISE 5.1
- For which of these would you use a histogram to show the data? (a) T...
Text Solution
|
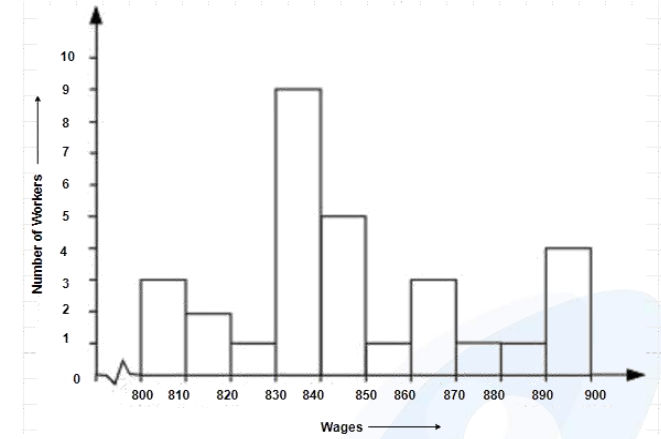
- The weekly wages (in Rs) of 30 workers in a factory are.830, 835, 890...
Text Solution
|
- The shoppers who come to a departmental store are marked as: man (M),...
Text Solution
|
- The number of hours for which students of a particular class watched ...
Text Solution
|
- Draw a histogram for the frequency table made for the data in Questio...
Text Solution
|