Text Solution
Verified by Experts


Topper's Solved these Questions
Similar Questions
Explore conceptually related problems
NCERT-DATA HANDLING-EXERCISE 5.2
- The adjoining pie chart gives the marks scored in an examination by a...
Text Solution
|
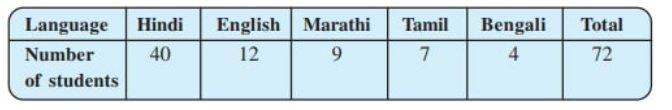
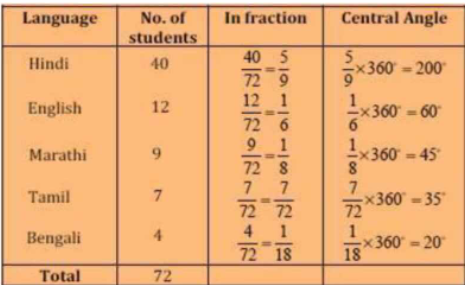
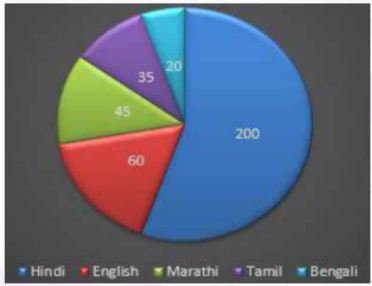
- The number of students in a hostel, speaking different languages is gi...
Text Solution
|
- A survey was made to find the type of music that a certain group of y...
Text Solution
|
- A group of 360 people were asked to vote for their favourite season f...
Text Solution
|
- Draw a pie chart showing the following information. The table shows th...
Text Solution
|