 .
.


Similar Questions
Explore conceptually related problems
Recommended Questions
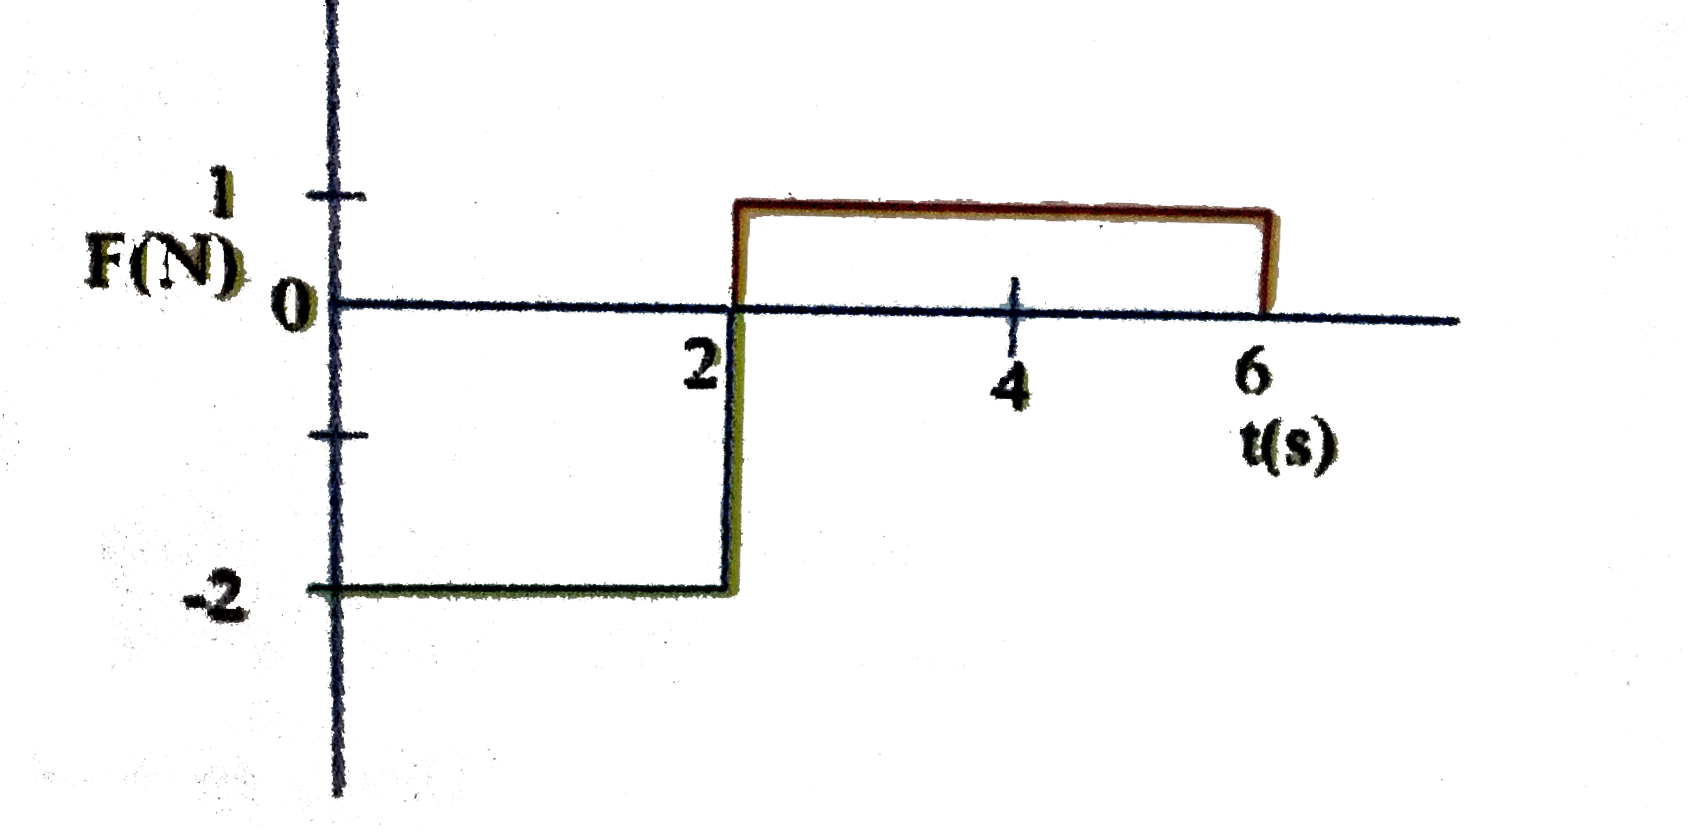
- A force time graph for the motion of a body is as shown in Change in l...
Text Solution
|
- A force-time graph for the motion of a body is shown in the figure. Th...
Text Solution
|
- Assertion : Torque is time rate of change of a parameter, called angua...
Text Solution
|
- A force time graph for the motion of a body is as shown in Change in l...
Text Solution
|
- A force - time graph for a linear motion is shown in the figure where ...
Text Solution
|
- A force-time graph for the motion of a body is shown in fig. change in...
Text Solution
|
- A force-time graph for the motion of a body is shown in fig. Change in...
Text Solution
|
- A force time graph for the motion of a body is as shown in figure. Cha...
Text Solution
|
- A force-time graph for the motion of a body is shown in figure. Change...
Text Solution
|