


Similar Questions
Explore conceptually related problems
Recommended Questions
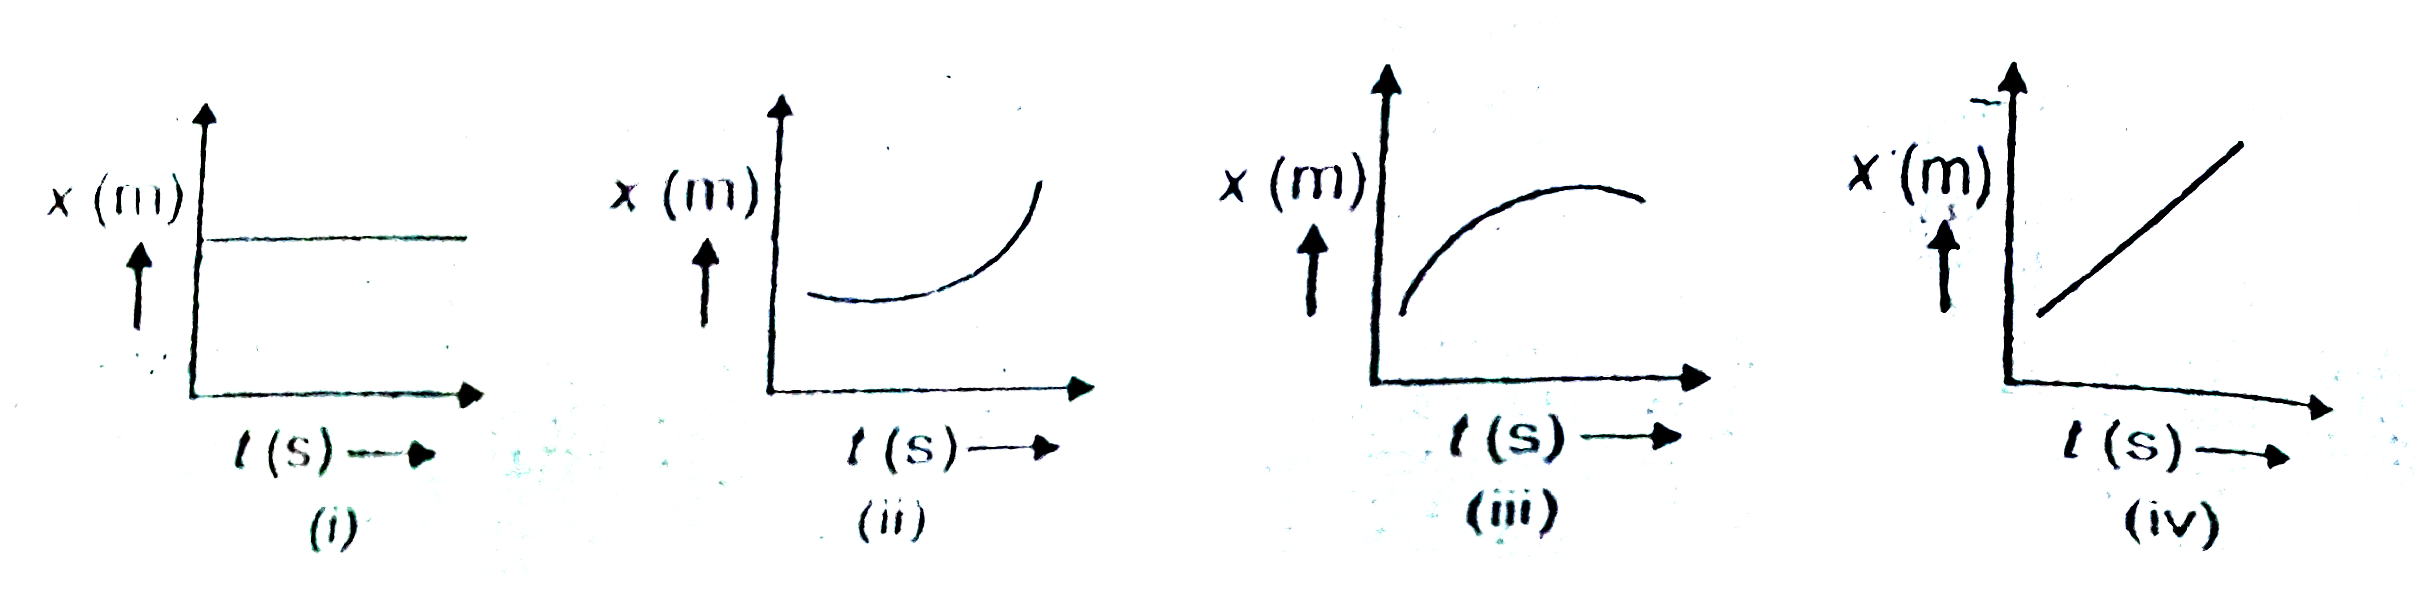
- Which of the following x-t graphs shows an object moving with negative...
Text Solution
|
- The v -t graph of a moving object is given in figure. The maximum acce...
Text Solution
|
- The following shows the time-velocity graph for a moving object. The m...
Text Solution
|
- Which graph corresponds to an object moving with a constant negative a...
Text Solution
|
- Which of the following x-t graphs shows an object moving with negative...
Text Solution
|
- Draw the velocity-time graph of an object moving with uniform negative...
Text Solution
|
- संलग्न चित्र में गतिमान वस्तु के लिए v - t ग्राफ प्रदर्शित किया गया है...
Text Solution
|
- Which of the following x - t graphs shows an object moving with negati...
Text Solution
|
- एक वस्तु विरामावस्था में नियत त्वरण से गति करती है , निम्न मे से कौन- ...
Text Solution
|