


Similar Questions
Explore conceptually related problems
Recommended Questions
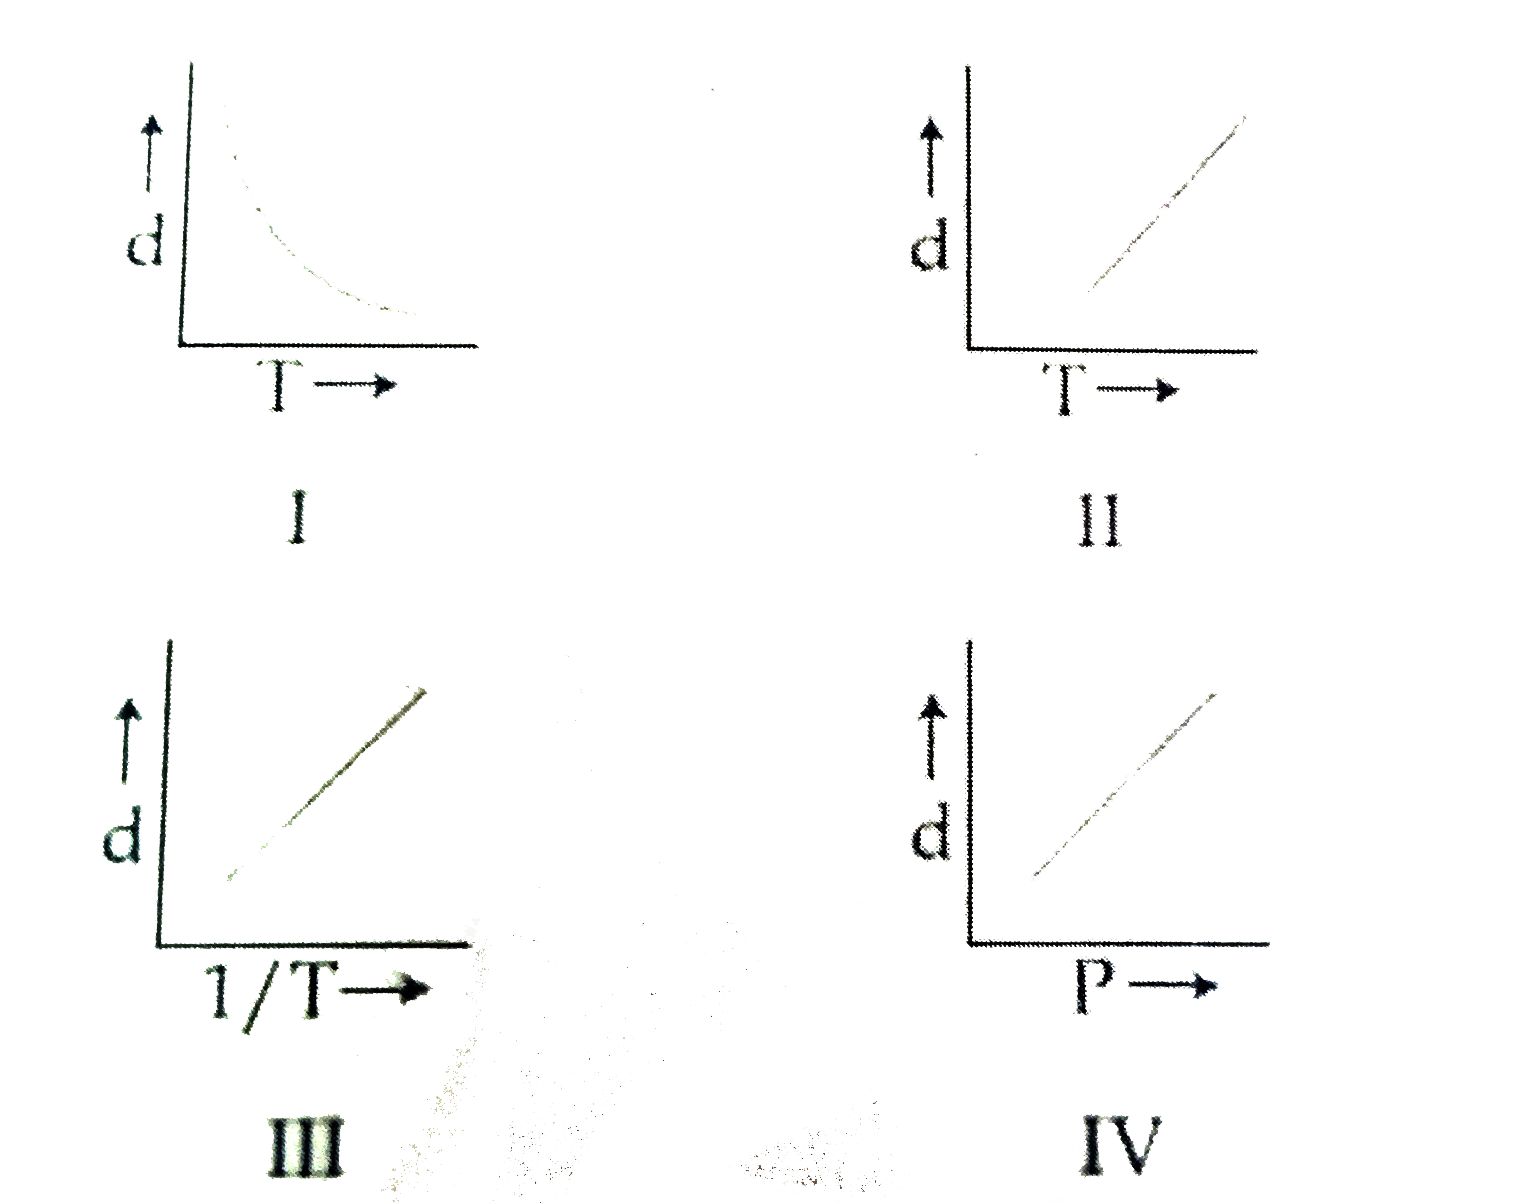
- which one of the following graph is not correct for ideal gas ? ...
Text Solution
|
- At a constant pressure, of the following graphs that one which represe...
Text Solution
|
- Figure shows graphs of pressure versus density for an ideal gas at two...
Text Solution
|
- An ideal gas expands following a relation (P^(2))/(rho)= constant, whe...
Text Solution
|
- Figure shows graphs of pressure vs density for an ideal gas at two tem...
Text Solution
|
- If P, V, M, T and R are symbols of pressure, volume, molecular weight,...
Text Solution
|
- which one of the following graph is not correct for ideal gas ? ...
Text Solution
|
- निम्न में से कौन - सा आयतन (V), ताप (T) ग्राफ ( आलेख ) , एक वायुमंडल...
Text Solution
|
- The equation of gas with respect to pressure (p) extreme temperature (...
Text Solution
|