


Similar Questions
Explore conceptually related problems
Recommended Questions
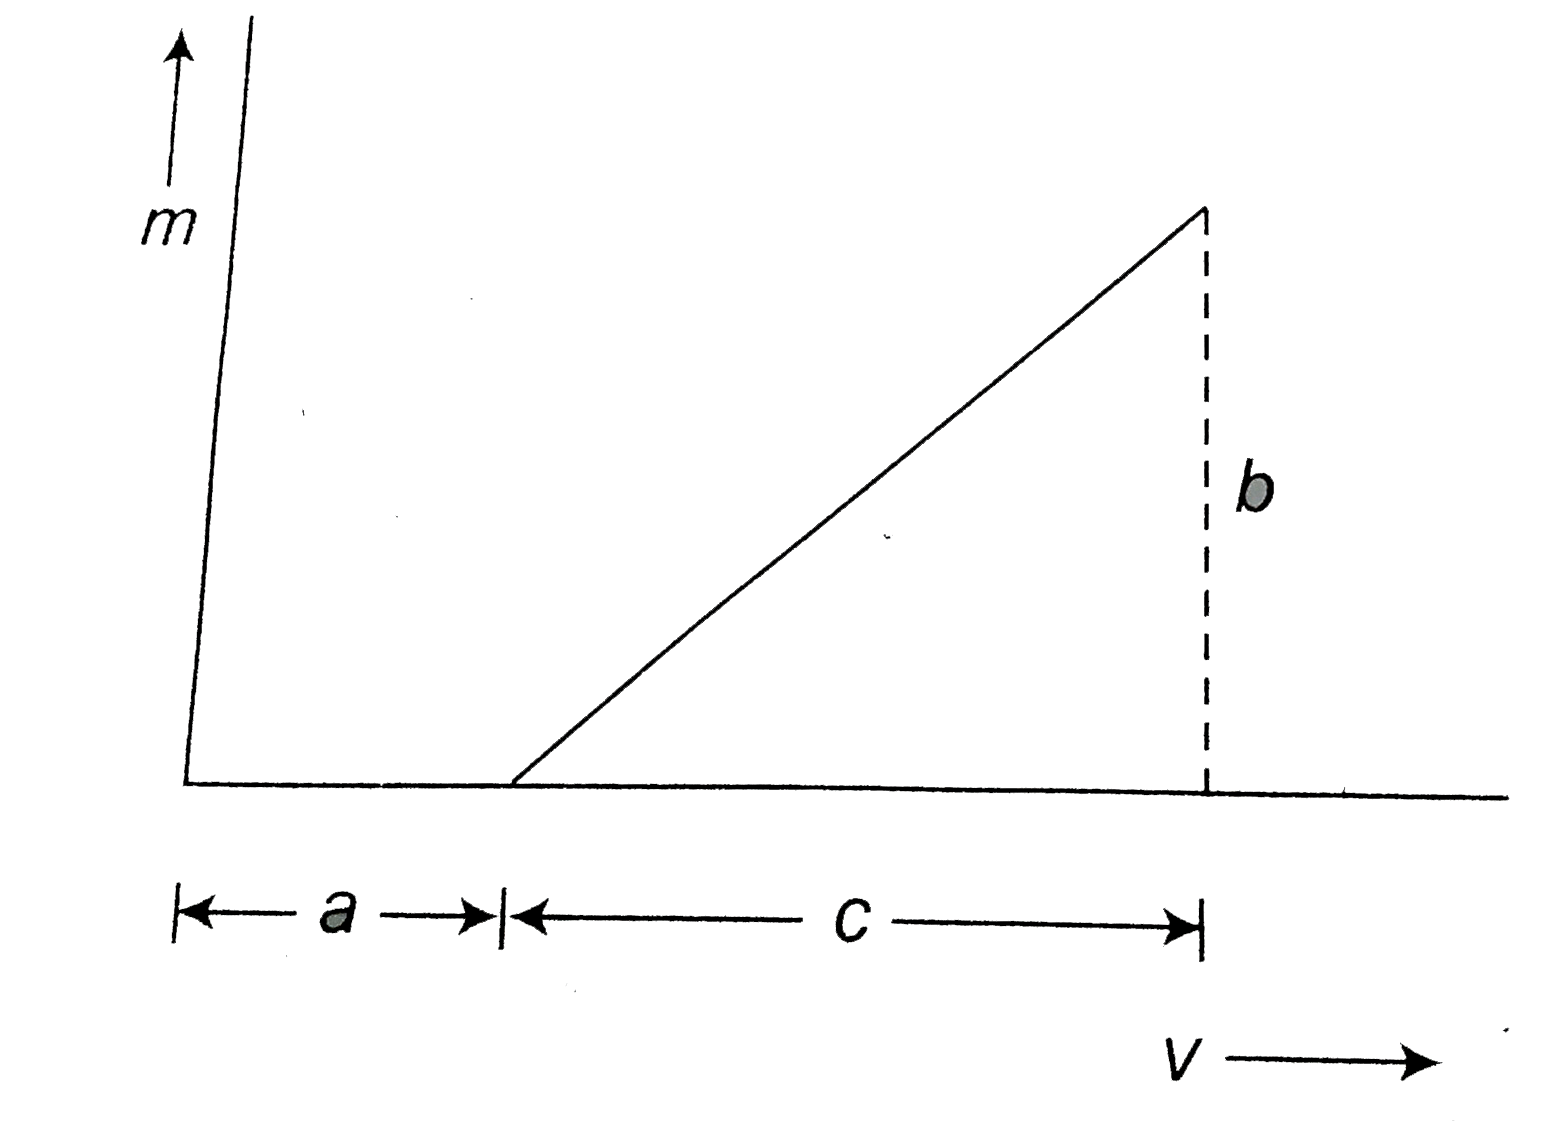
- The graps shows the variation of magnification m produced by as conve...
Text Solution
|
- Figure, shows variation of magnification m (produced by a thin convex ...
Text Solution
|
- The graph shows how the magnification m produced by a convex thin len...
Text Solution
|
- The graps shows the variation of magnification m produced by as convex...
Text Solution
|
- Variation of magnification "("m")" produced by a thin convex lens vers...
Text Solution
|
- The graph shows how the magnification m produced by a thin lens varies...
Text Solution
|
- A convex lens is used to obtain a magnified image of an object on a sc...
Text Solution
|
- The distance between the object and the real image formed by a convex ...
Text Solution
|
- A convex lens of focal length f produces a real image m times the size...
Text Solution
|