A
B
C
D
Text Solution
Verified by Experts
The correct Answer is:


Topper's Solved these Questions
BIOMOLECULES
MODERN PUBLICATION|Exercise COMPETITION FILE OBJECTIVE TYPE QUESTIONS (MULTIPLE CHOICE QUESTIONS)|1 VideosBIOMOLECULES
MODERN PUBLICATION|Exercise CHAPTER PRACTICE TEST|16 VideosBIOMOLECULES
MODERN PUBLICATION|Exercise COMPETITION FILE (OBJECTIVE TYPE QUESTIONS) (ANALOGY TYPE QUESTIONS )|10 VideosBIOLOGICAL CLASSIFICATION
MODERN PUBLICATION|Exercise CHAPTER PRACTICE TEST|16 VideosBODY FLUIDS AND CIRCULATION
MODERN PUBLICATION|Exercise Chapter Practice Test|15 Videos
Similar Questions
Explore conceptually related problems
MODERN PUBLICATION-BIOMOLECULES -COMPETITION FILE (OBJECTIVE TYPE QUESTIONS) (ADDITIONAL MULTIPLE CHOICE QUESTIONS )
- Which is protein in nature ?
Text Solution
|
- Which is a reducing sugar ?
Text Solution
|
- Among following natural materials , largest amount of cellulose is fou...
Text Solution
|
- The polysaccharide formed from fructose monomers only is :
Text Solution
|
- An organic substance bound to an enzyme and essential for its activ...
Text Solution
|
- One turn of the helix in a B-form DNA is approximately-
Text Solution
|
- Antiparallel strands of a DNA molecule means that :
Text Solution
|
- In which one of the following sets of three items each belong to the c...
Text Solution
|
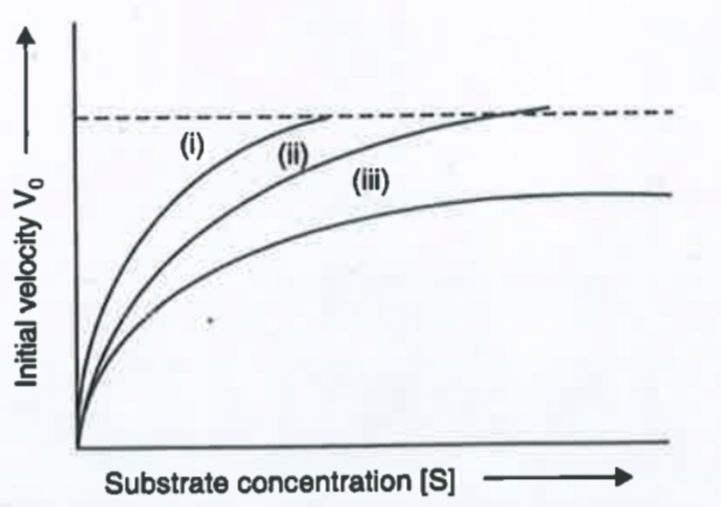
- The figure given below shows three velocity - substrate concentration ...
Text Solution
|
- Chitinous exoskeleton is found in
Text Solution
|
- Which enzyme converts glucose into alcohol ?
Text Solution
|
- One mole of glucose on metabolism liberate how many kilo calories of e...
Text Solution
|
- Phosphodiester bond is present in :
Text Solution
|
- In which virus, DNA is double stranded
Text Solution
|
- Which is the most abundant protein on earth ?
Text Solution
|
- Essential amino acid which is synthesized by plant is :
Text Solution
|
- Enzyme responsible for conversion of glucose to C(2) H(5) OH is :
Text Solution
|
- How many of the twenty amino acids are essential amino acids for chil...
Text Solution
|
- Bacterial cell wall is composed of
Text Solution
|
- Allosteric modulation is due to the inhibition action of enzyme by
Text Solution
|