Text Solution
Verified by Experts


Topper's Solved these Questions
MOTION IN A STRAIGHT LINE
MODERN PUBLICATION|Exercise NCERT (ADDITIONAL EXERCISE)|6 VideosMOTION IN A STRAIGHT LINE
MODERN PUBLICATION|Exercise NCERT (VERY SHORT ANSWER TYPE QUESTION)|5 VideosMOTION IN A STRAIGHT LINE
MODERN PUBLICATION|Exercise TOUGH & TRICKY ( PROBLEMS)|10 VideosMOTION IN A PLANE
MODERN PUBLICATION|Exercise Chapter Practice Test|15 VideosOSCILLATIONS
MODERN PUBLICATION|Exercise Practice Test (For Board Examination)|12 Videos
Similar Questions
Explore conceptually related problems
MODERN PUBLICATION-MOTION IN A STRAIGHT LINE -NCERT (TEXTBOOK EXERCISES )
- A woman starts from her home at 9.00 a. m., walks with a speed of 5 km...
Text Solution
|
- A drunkard walking in a narrow lane takes 5 steps forward and 3 steps ...
Text Solution
|
- A jet airplance travelling at the speed of 500 km ^(-1) ejects its pr...
Text Solution
|
- A car moving aling a straight highway with speed of 126 km h^(-1) is ...
Text Solution
|
- Two trains A and B of length 400 m each are moving on two parallel tra...
Text Solution
|
- On a two - lane road, car A is travelling with a speed of 36 kmph. Two...
Text Solution
|
- Two towns A and B are connected by a regular bus service with a bus le...
Text Solution
|
- A player throwsa a ball upwards with an initial speed of 29.4 ms^(-1)...
Text Solution
|
- Read each staremnt below carefully and state with reasons and expample...
Text Solution
|
- A ball is dropped from a height of a height of 90 m on a floor. At eac...
Text Solution
|
- Explain clearly, with ezamples, the difference between : (a) magnitu...
Text Solution
|
- A man walks on a straight road from his home to a market 2.5 km away w...
Text Solution
|
- In abave questions 13 and 14, we have carefully distinguished betwee...
Text Solution
|
- Look at the graphs (a) to (d) carefully and state, with reasons, which...
Text Solution
|
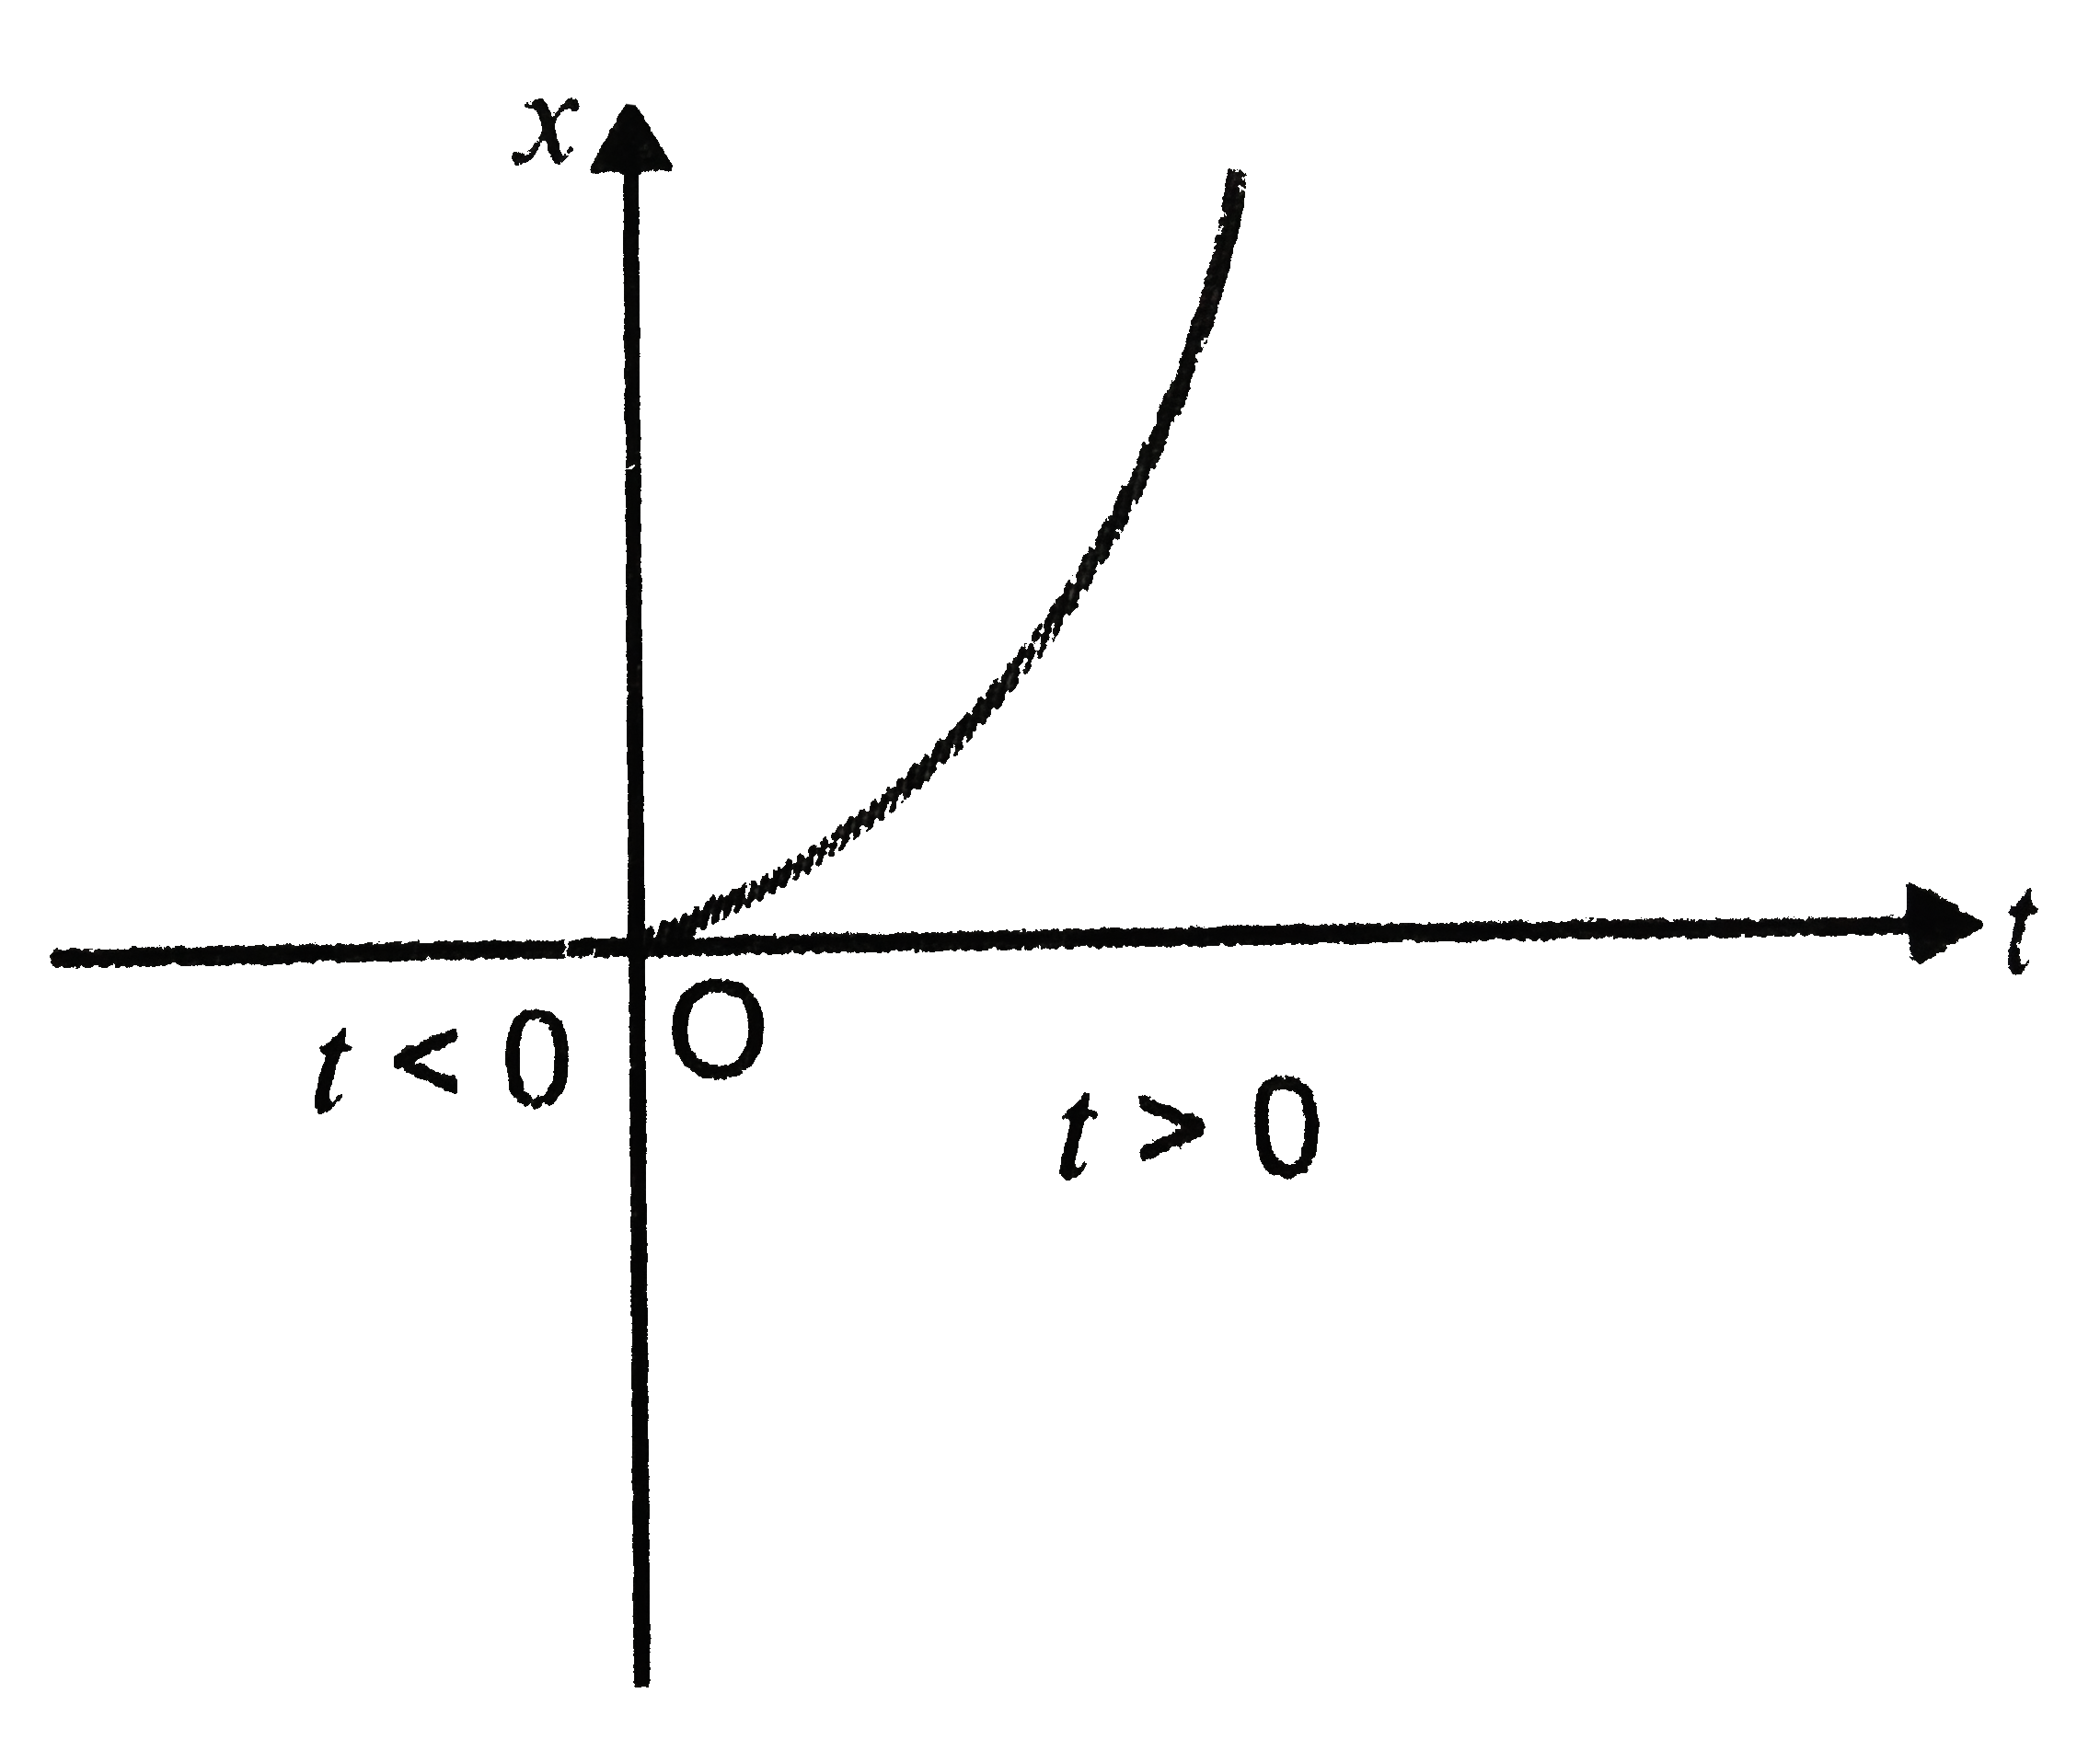
- Fig. 2 (NCT). 6 shows x-t plot of one dismensional motion a particle....
Text Solution
|
- A police van moving on a highway with a speed of 30 km h^(-1) Fires a ...
Text Solution
|
- Suggest a suitable physical situation for each of the following graphs...
Text Solution
|
- Fig 2 (NCT).8 gives the x-t plot of a particle executing one dimensio...
Text Solution
|
- Fig. 2 (NCT).9 show the x-t plot of a particle in one dimensional mot...
Text Solution
|
- चित्र में किसी नियत (स्थिर) दिशा के अनुदिश चल रहे कण का चाल-समय ग्राफ ...
Text Solution
|