Text Solution
Verified by Experts


Topper's Solved these Questions
MOTION IN A STRAIGHT LINE
MODERN PUBLICATION|Exercise NCERT (VERY SHORT ANSWER TYPE QUESTION)|5 VideosMOTION IN A STRAIGHT LINE
MODERN PUBLICATION|Exercise NCERT (SHORT ANSWER TYPE QUESTION)|6 VideosMOTION IN A STRAIGHT LINE
MODERN PUBLICATION|Exercise NCERT (TEXTBOOK EXERCISES )|22 VideosMOTION IN A PLANE
MODERN PUBLICATION|Exercise Chapter Practice Test|15 VideosOSCILLATIONS
MODERN PUBLICATION|Exercise Practice Test (For Board Examination)|12 Videos
Similar Questions
Explore conceptually related problems
MODERN PUBLICATION-MOTION IN A STRAIGHT LINE -NCERT (ADDITIONAL EXERCISE)
- A three wheeler starts from rest, accelerates uniformly with 1 ms^(-2...
Text Solution
|
- A boy standing on a stationary lift ( open from above ) throws a ball ...
Text Solution
|
- Ona long horizontally moving belt, a child runs to and fro with a spee...
Text Solution
|
- Two stones are thrown up simultaneously from the edge of a cliff 200 ...
Text Solution
|
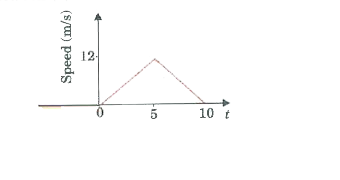
- The speed-time graph of a particle moving along a fixed direction is s...
Text Solution
|
- The velocity-time graph of a particle in one-dimensional motion is sho...
Text Solution
|