A
B
C
D
Text Solution
Verified by Experts
The correct Answer is:


Topper's Solved these Questions
MOTION IN A STRAIGHT LINE
MODERN PUBLICATION|Exercise NCERT (MULTIPLE CHOICE QUESTION (TYPE-II))|5 VideosMOTION IN A STRAIGHT LINE
MODERN PUBLICATION|Exercise HIGHER ORDER THINKING SKILL AND ADVANCED LEVEL QUESTION WITH ANSWER|5 VideosMOTION IN A STRAIGHT LINE
MODERN PUBLICATION|Exercise NCERT (SHORT ANSWER TYPE QUESTION)|6 VideosMOTION IN A PLANE
MODERN PUBLICATION|Exercise Chapter Practice Test|15 VideosOSCILLATIONS
MODERN PUBLICATION|Exercise Practice Test (For Board Examination)|12 Videos
Similar Questions
Explore conceptually related problems
MODERN PUBLICATION-MOTION IN A STRAIGHT LINE -NCERT (MULTIPLE CHOICE QUESTION (TYPE-I))
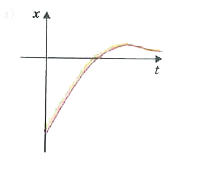
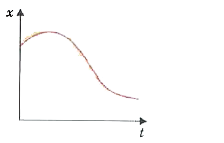
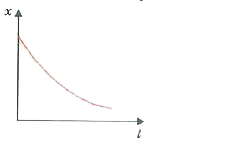
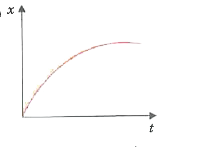
- Among the four graphs shown in the figure there is only one graph for ...
Text Solution
|
- A lift is coming from 8th floor and is just about to reach 4th floor. ...
Text Solution
|
- In one dimensional motion, instantaneous speed v satisfies (0 le v lt ...
Text Solution
|
- A vehicle travels half the distance (L) with speed V1 and the other h...
Text Solution
|
- The displacement of a particle is moving by x = (t - 2)^2 where x is i...
Text Solution
|
- At a metro station, a girl walks up a stationary escalator in time t1 ...
Text Solution
|