


Similar Questions
Explore conceptually related problems
Recommended Questions
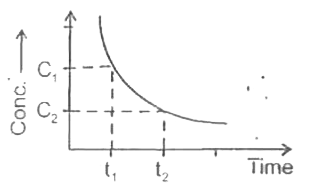
- The graph plotted between concentration versus time
Text Solution
|
- For a zero order reaction the plot of concentration of reactant versus...
Text Solution
|
- The plote between concentration versus time for a zero order reaction ...
Text Solution
|
- In the plot of concentration of reactant versus time, the tangent at a...
Text Solution
|
- The plot between concentration versus time for a zero order reaction i...
Text Solution
|
- A graph is plotted between the temperature of a copper cube in .^(@)C ...
Text Solution
|
- Two plots are shown below between concentration and time t. Which of t...
Text Solution
|
- For a zero order reaction, the plot of concentration versus time is li...
Text Solution
|
- The graph plotted between concentration versus time
Text Solution
|