


Similar Questions
Explore conceptually related problems
Recommended Questions
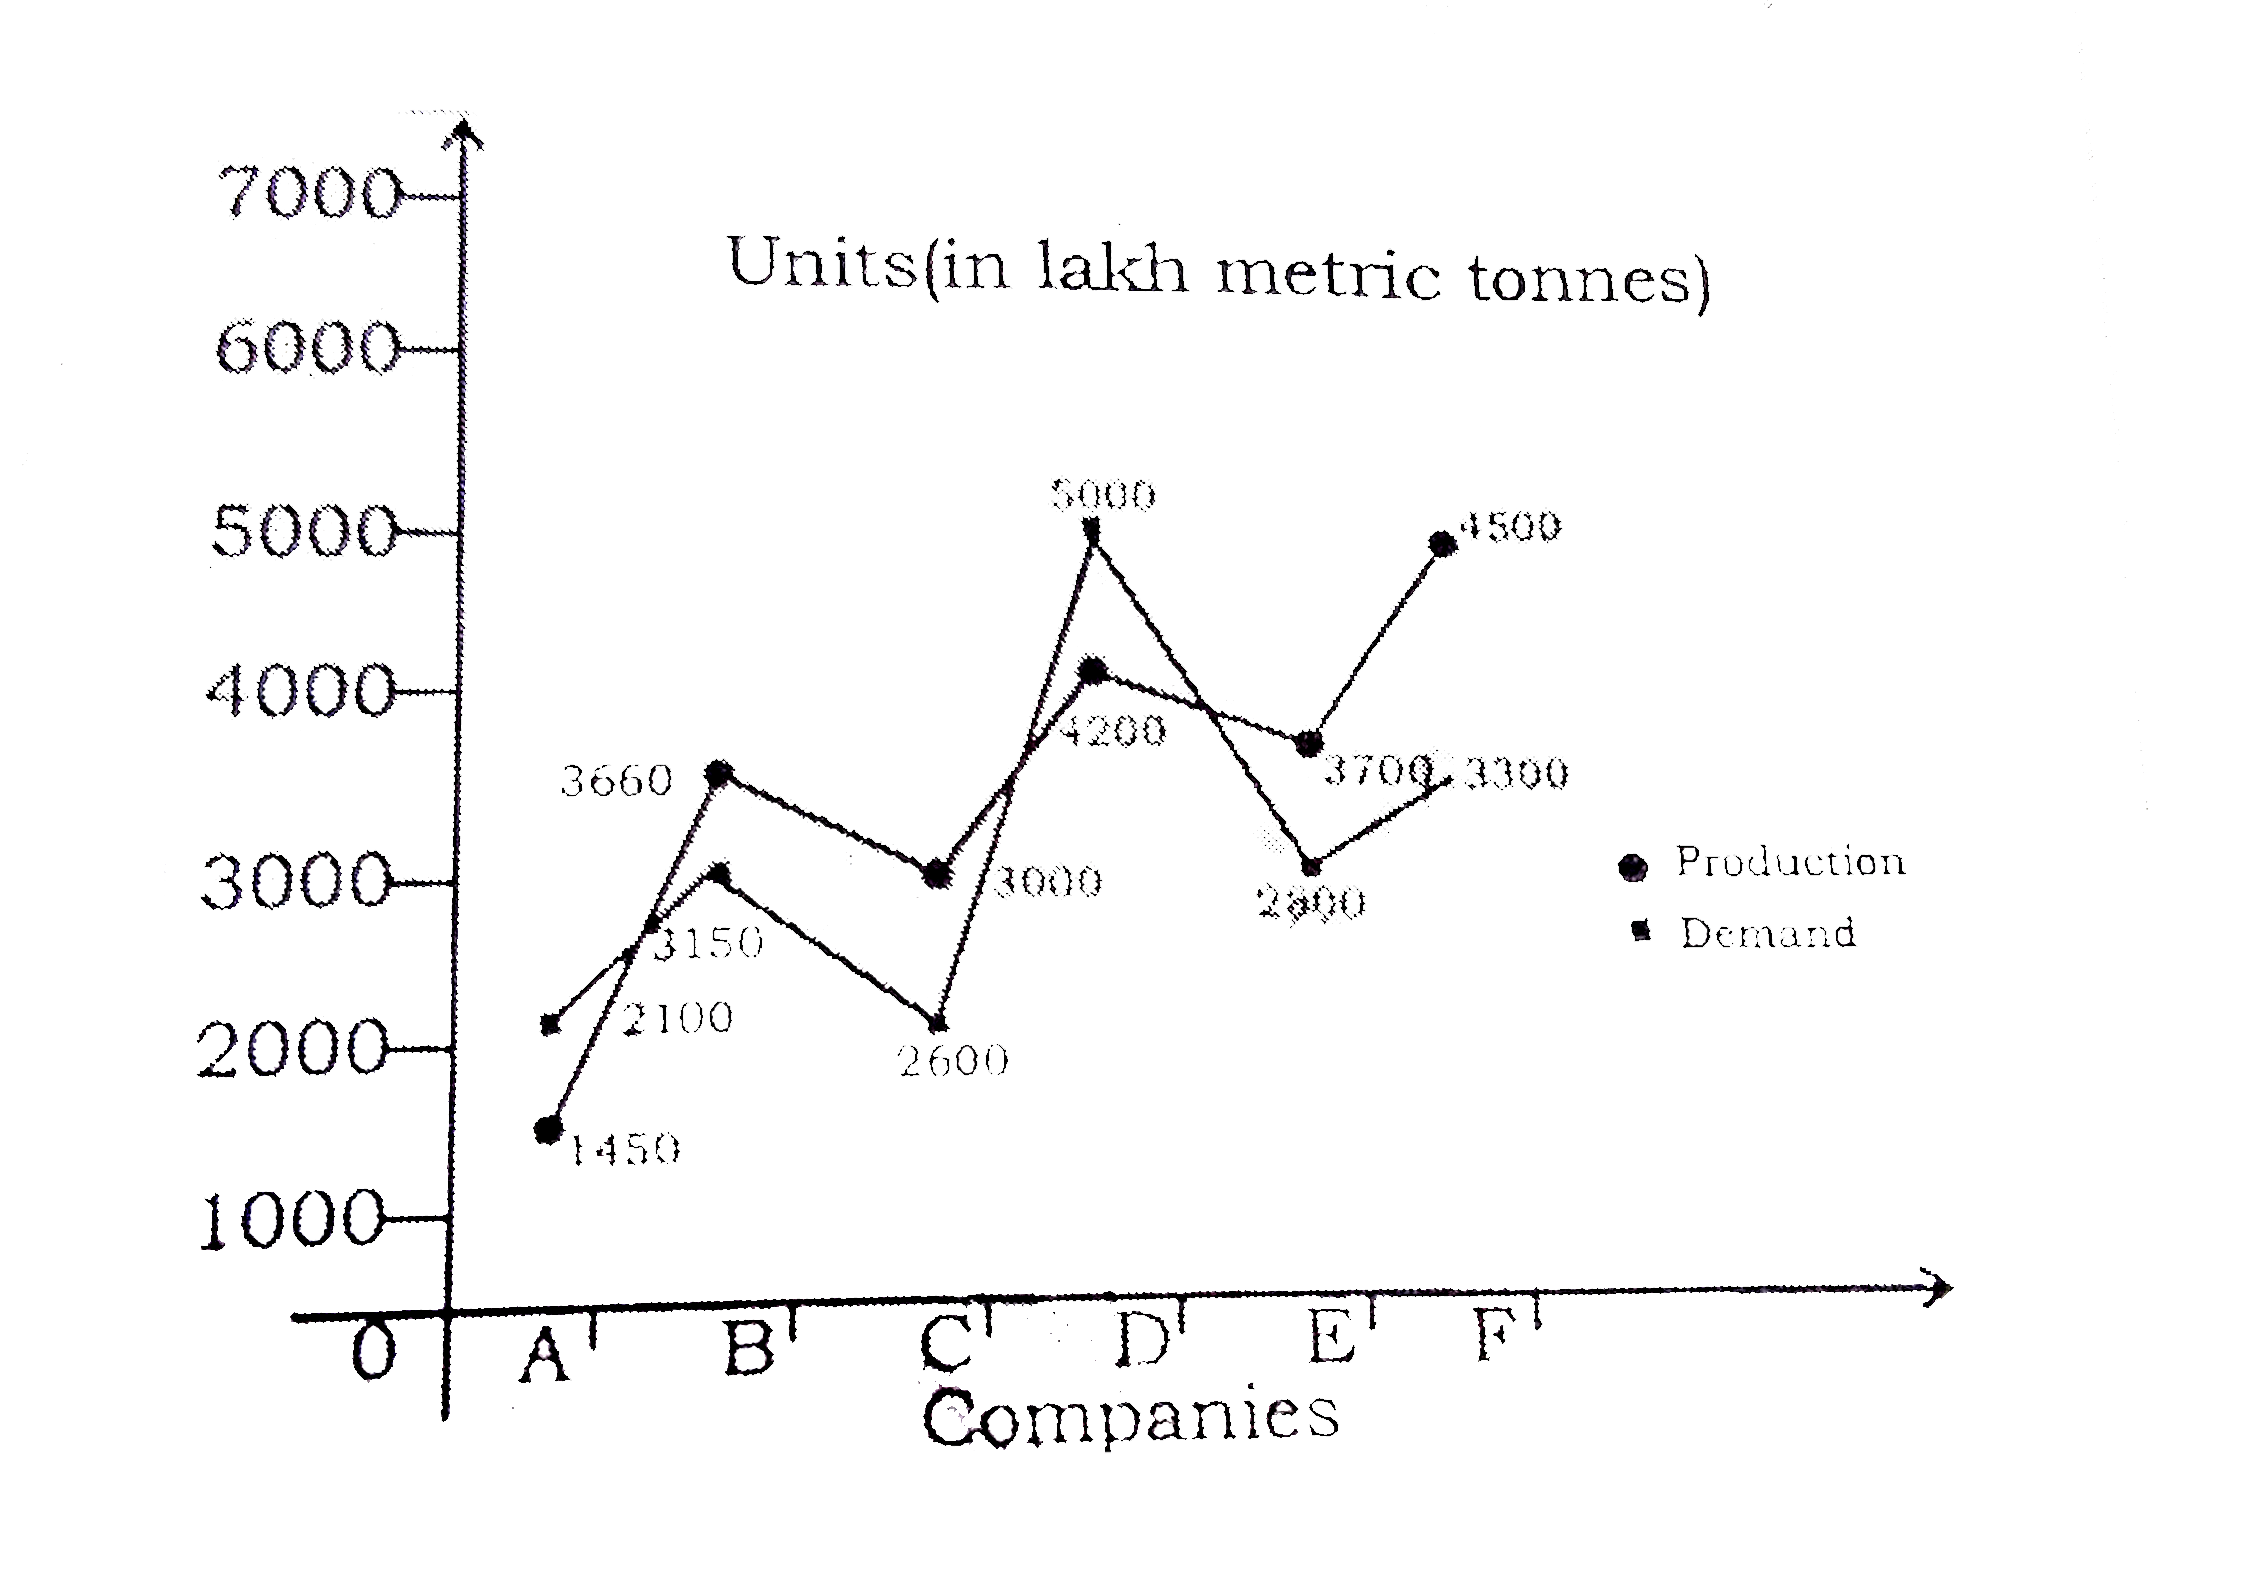
- निर्देश :- दिए गए ग्राफ में विभिन्न कंपनियों के मांग तथा उत्पादन को दर...
Text Solution
|
- Determine the point of symmetry of a regular hexagon. <img src="htt...
Text Solution
|
- Match the following Column A to Column B
Text Solution
|
- निचे दिये गये ग्राफ में दो प्रकार के वाहनों A व B के छ वर्षो के प्रद...
Text Solution
|
- निचे दिये गये ग्राफ में दो प्रकार के वाहनों A व B के छ वर्षो के प्रद...
Text Solution
|
- निचे दिये गये ग्राफ में दो प्रकार के वाहनों A व B के छ वर्षो के प्रद...
Text Solution
|
- निचे दिये गये ग्राफ में दो प्रकार के वाहनों A व B के छ वर्षो के प्रद...
Text Solution
|
- Study the following bar graph and answer the question given. निम्नलिखि...
Text Solution
|
- Study the following graph which shows the production (in thousand) of ...
Text Solution
|