A
B
C
D
Text Solution
Verified by Experts
The correct Answer is:


Similar Questions
Explore conceptually related problems
Recommended Questions
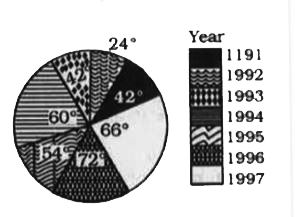
- The pie-chart represents the profits earned by a certain company in se...
Text Solution
|
- Following information is available for the year 2016-17, calculate gro...
Text Solution
|
- Study the following graph carefully and answer the questions that foll...
Text Solution
|
- The pie-chart represents the profits earned by a certain company in se...
Text Solution
|
- The pie-chart represents the profits earned by a certain company in se...
Text Solution
|
- The pie-chart represents the profits earned by a certain company in se...
Text Solution
|
- The pie-chart represents the profits earned by a certain company in se...
Text Solution
|
- The given pie chart shows expenditure on different type of sport in a ...
Text Solution
|
- The following array shows the income and percentage profit of five com...
Text Solution
|