A
B
C
D
Text Solution
Verified by Experts
The correct Answer is:


Recommended Questions
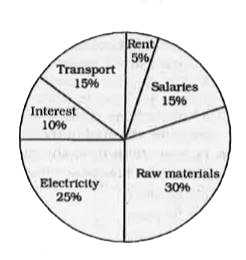
- The pie-chart shows the breakup in percent age of the various expenses...
Text Solution
|
- Match the following Column A to Column B
Text Solution
|
- The inequation that best describes the following graph is <img src="h...
Text Solution
|
- The pie-chart shows the breakup in percent age of the various expenses...
Text Solution
|
- The pie-chart shows the breakup in percent age of the various expenses...
Text Solution
|
- The pie-chart shows the breakup in percent age of the various expenses...
Text Solution
|
- The pie-chart shows the breakup in percent age of the various expenses...
Text Solution
|
- The following pie-chart shows the market share of four companies S, T,...
Text Solution
|
- The pie-chart given below shows the percentage distribution of annual ...
Text Solution
|