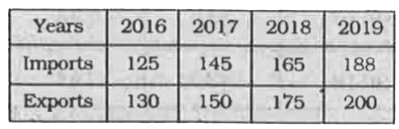
 The average trade balanc (in Rs. Crores) is:
A
B
C
D
Text Solution
Verified by Experts
The correct Answer is:


Similar Questions
Explore conceptually related problems
Recommended Questions
- The following table shows the imports and exports (in Rs. Crore) of a ...
Text Solution
|
- If the value of exports of a country is Rs 1,000 crores and the value ...
Text Solution
|
- The Balance of Trade shows a deficit of Rs 300 crores. The value of ex...
Text Solution
|
- The balance of trade shows a deficit of Rs 5,000 crores and the value ...
Text Solution
|
- If value of exports of country is Rs 11000 crore and value of imports ...
Text Solution
|
- If the value of exports of a country is Rs 11000 crore and the value o...
Text Solution
|
- The balance of trade shows a deficit of Rs 300 crore. The value of exp...
Text Solution
|
- Determine the point of symmetry of a regular hexagon. <img src="htt...
Text Solution
|
- Dtermine the images of the following figure about the given line : ...
Text Solution
|