


Similar Questions
Explore conceptually related problems
Recommended Questions
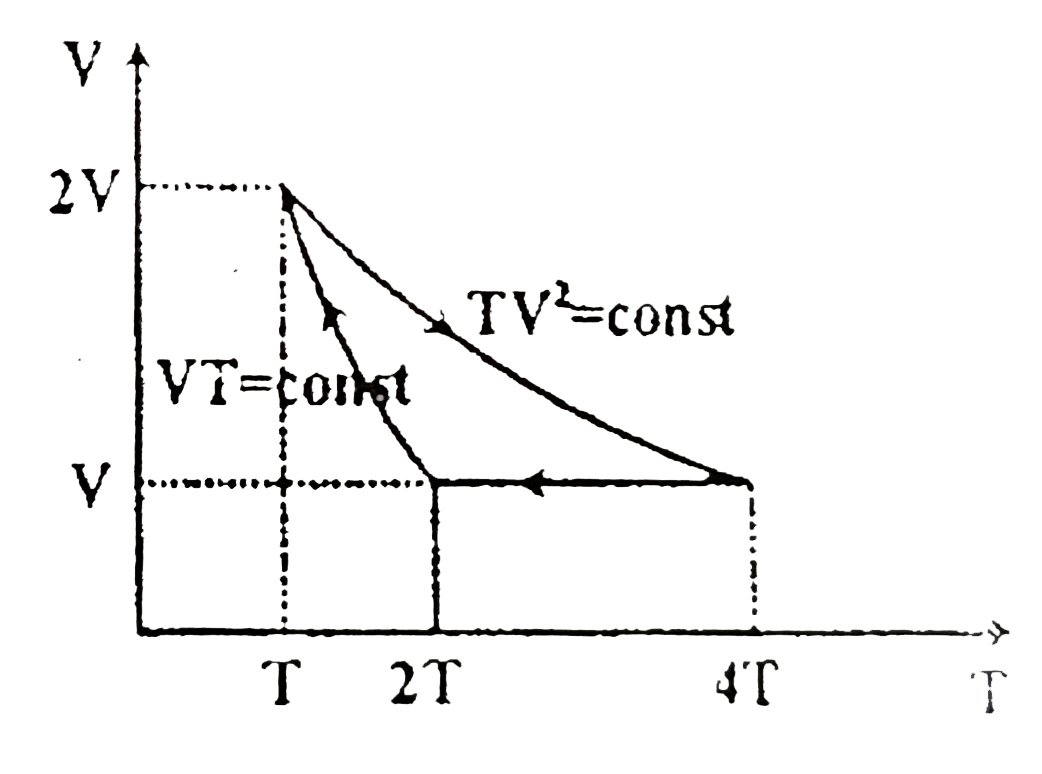
- Figure shows the VT diagram for helium gas in a cyclic process. Find t...
Text Solution
|
- Consider PT graph of cyclic process shown in the figure. Maximum press...
Text Solution
|
- Consider PT graph of cyclic process shown in the figure. Maximum press...
Text Solution
|
- Figure shows the VT diagram for helium gas in a cyclic process. Find t...
Text Solution
|
- An ideal monatomic gas undergoes a cyclic process ABCA as shown in the...
Text Solution
|
- Two moles of Helium gas undergo a reversible cyclic process as shown i...
Text Solution
|
- A cyclic process ABCD is shown in VT diagram for an ideal gas. Which o...
Text Solution
|
- An ideal monoatomic gas goes through a cyclic process. Ratio of maximu...
Text Solution
|
- Two moles of helium gas undergo a cyclic process as shown in figure. A...
Text Solution
|