


Similar Questions
Explore conceptually related problems
Recommended Questions
- For a photoelectric cell, the graph shown the variation of c...
Text Solution
|
- Which one of the following graphs in figure shows the variation of pho...
Text Solution
|
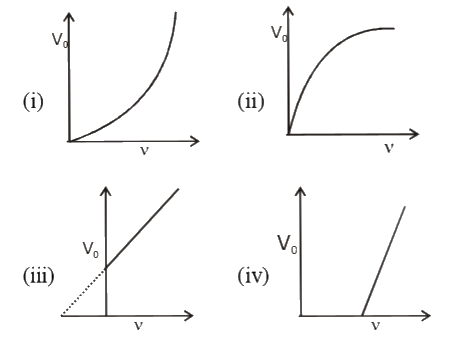
- For a photoelectric cell the graph showing the variation of cut of vol...
Text Solution
|
- For a photoelectric cell the graph showing the variation of cut of vol...
Text Solution
|
- The threshold frequency for a certain metal is 3.3xx10^(14) Hz. If lig...
Text Solution
|
- For photoelectric effect in sodium, the figure shows the plot of cut-o...
Text Solution
|
- For a photoelectric cell, the graph shown the variation of cut off vol...
Text Solution
|
- In an experiment on the photoelectric effect , the slope of the cut - ...
Text Solution
|
- किसी प्रकाश-वैद्युत सेल के लिये, आपतित प्रकाश की आवृत्ति v के साथ अवरो...
Text Solution
|