


Similar Questions
Explore conceptually related problems
Recommended Questions
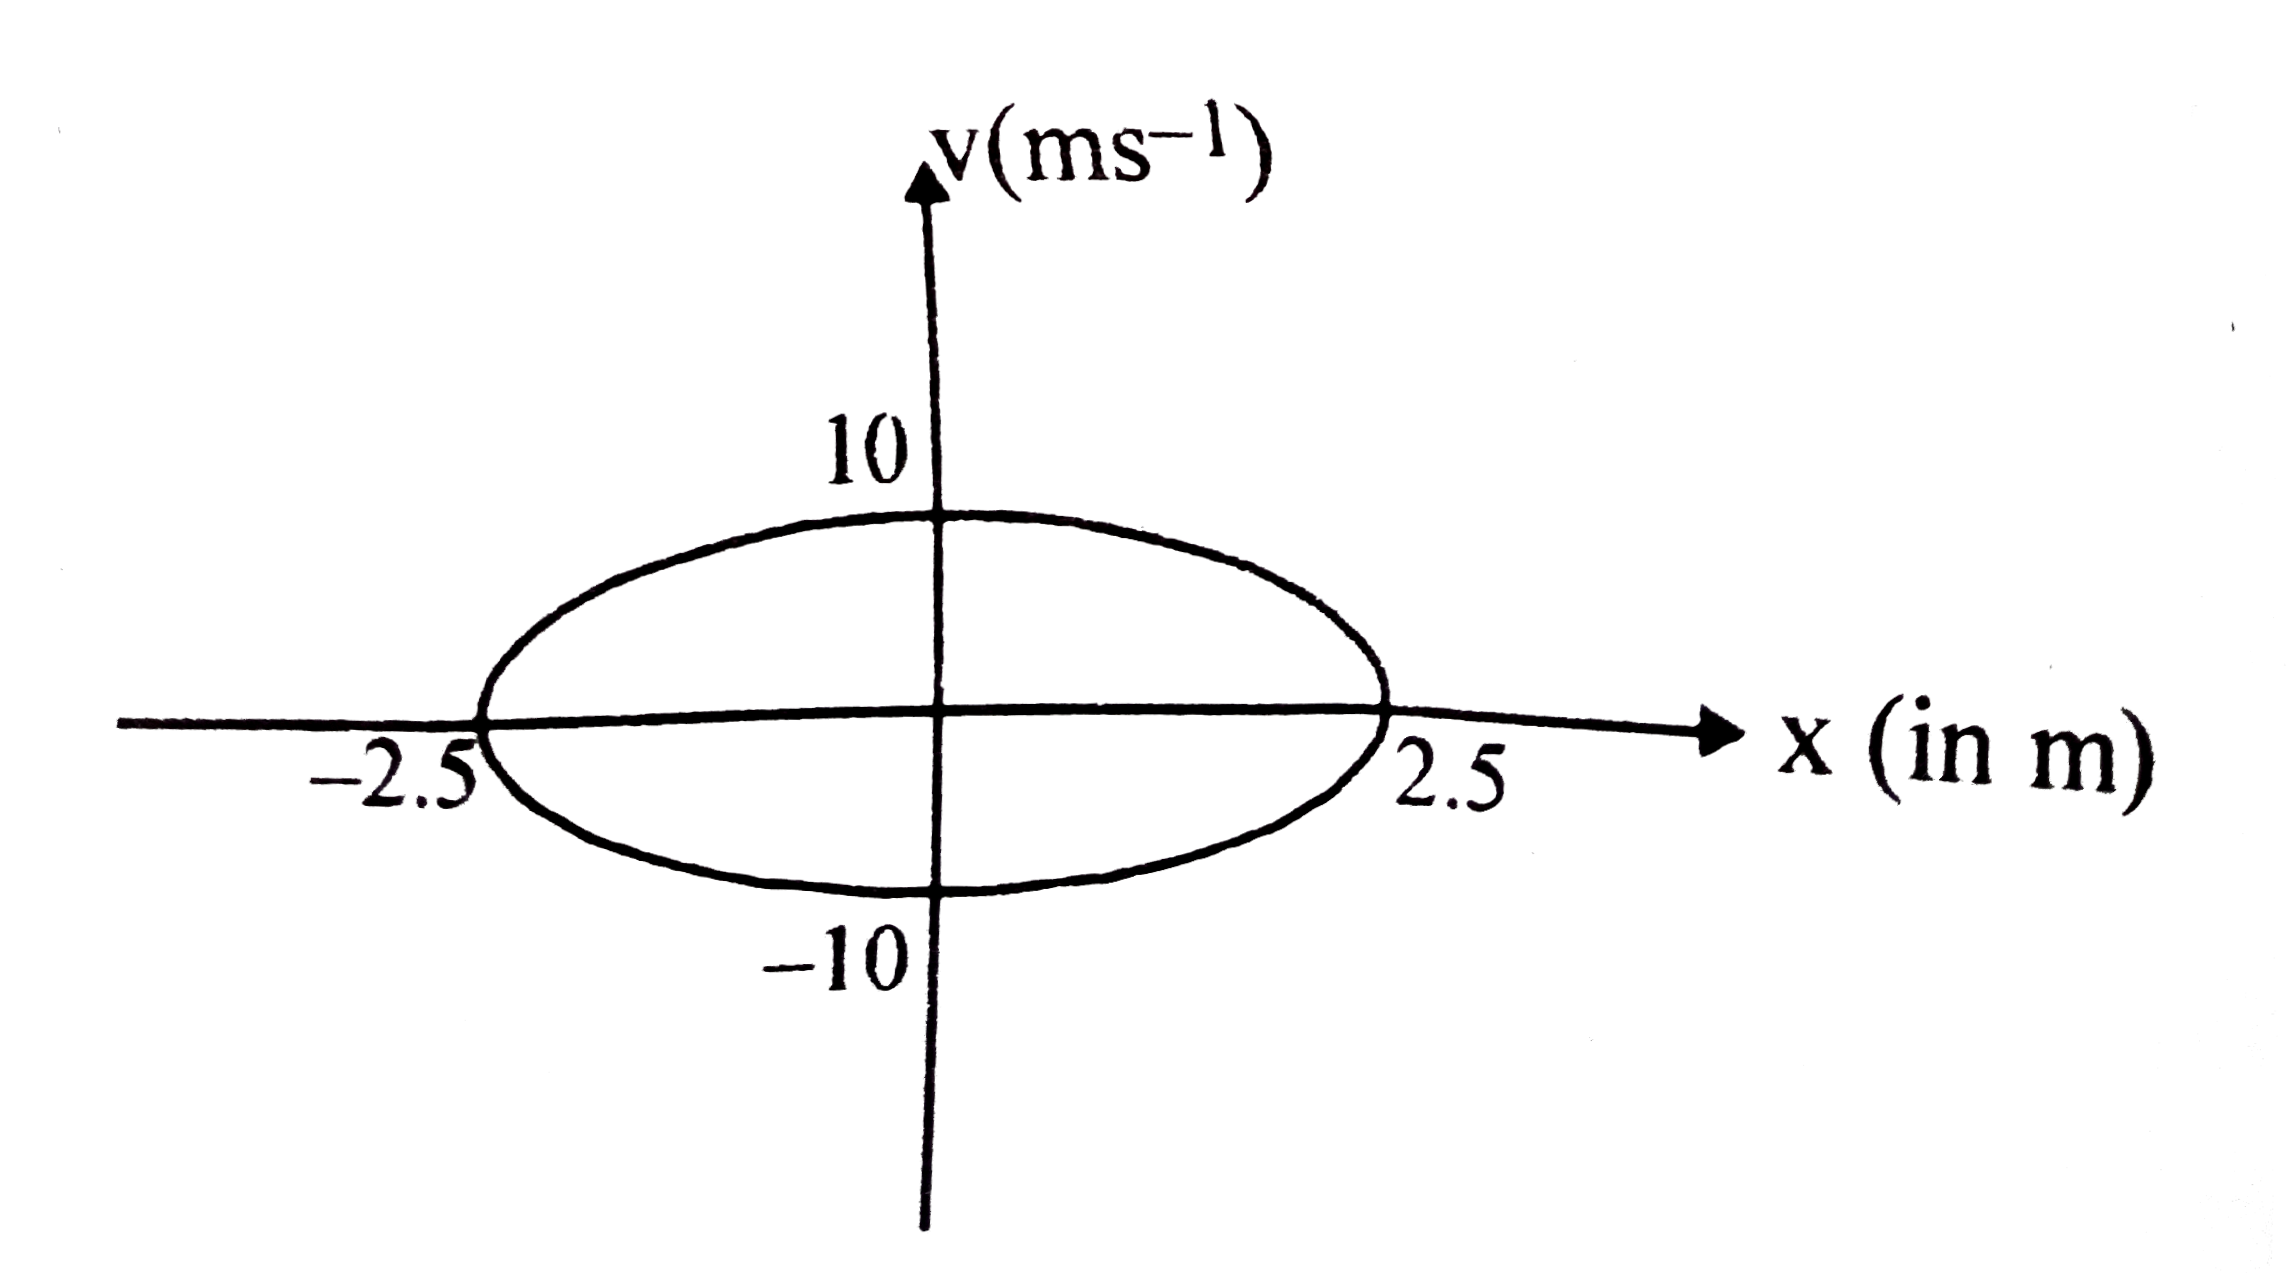
- The figure shows graph between velocity 'V' and displacement 'X' from ...
Text Solution
|
- A particle executes simple harmonic motion with an amplitude of 4cm At...
Text Solution
|
- The figure shows a graph between velocity and displacement (from mean ...
Text Solution
|
- The figure shows graph between velocity 'V' and displacement 'X' from ...
Text Solution
|
- The figure shows graph between velocity 'V' and displacement 'X' from ...
Text Solution
|
- A particle executes simple harmonic motion with an amplitude of 4 cm ....
Text Solution
|
- The velocity of a particle performing simple harmonic motion, when it ...
Text Solution
|
- The velocity of a particle in simple harmonic motion at displacement y...
Text Solution
|
- If a graph is plotted between velocity (v) and displacement (y) of a p...
Text Solution
|