


Similar Questions
Explore conceptually related problems
Recommended Questions
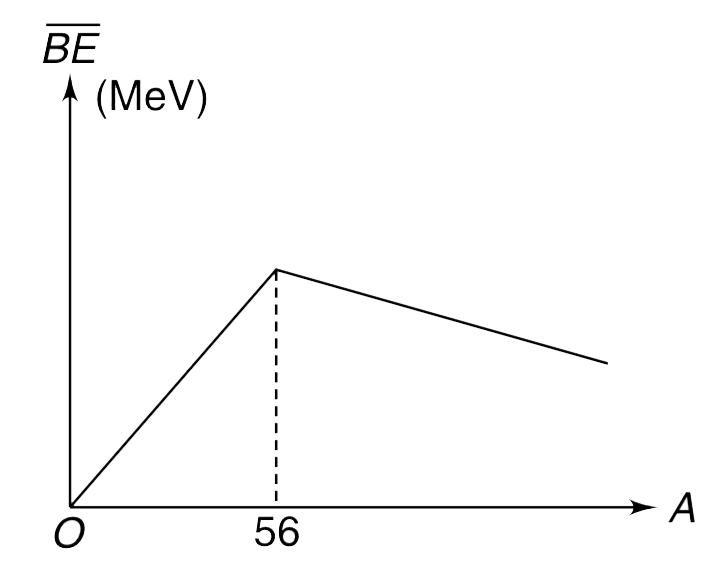
- The graph of binding energy per nucleon (overlineBE) versus mass numbe...
Text Solution
|
- The binding energy per nucleon of nucleus is a measure of its.
Text Solution
|
- Maximum value of binding energy per nucleon for most stable nuclei is
Text Solution
|
- The graph between the binding energy per nucleon (E) and atomic mass n...
Text Solution
|
- Draw the graph showing thervariation of binding energy per nucleon wit...
Text Solution
|
- The graph of binding energy per nucleon (overlineBE) versus mass numbe...
Text Solution
|
- Binding energy per nucleon plot against the mass number for stable nuc...
Text Solution
|
- VARIATION OF BINDING ENERGY OF PER NUCLEON WITH MASS NUMBER
Text Solution
|
- Compute the binding energy per nucleon of ""(2)^(4)"He" nucleus.
Text Solution
|