


Similar Questions
Explore conceptually related problems
Recommended Questions
- The position - time graph for a particle moving along a straight line ...
Text Solution
|
- Velocity-time graph of a particle moving in a straight line is shown i...
Text Solution
|
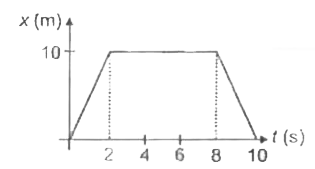
- The x-t graph of a particle moving along a straight line is shown in f...
Text Solution
|
- For a particle moving in a straight line, the position-time graph is a...
Text Solution
|
- The position versus time graph of a particle moving along a straight l...
Text Solution
|
- The velocity time graph of a particle moving along a straight line is ...
Text Solution
|
- The speed-time graph of a particle moving along a fixed direction as s...
Text Solution
|
- The figure shows a velocity-time graph of a particle moving along a st...
Text Solution
|
- The figure shows a velocity-time graph of a particle moving along a st...
Text Solution
|