


Similar Questions
Explore conceptually related problems
Recommended Questions
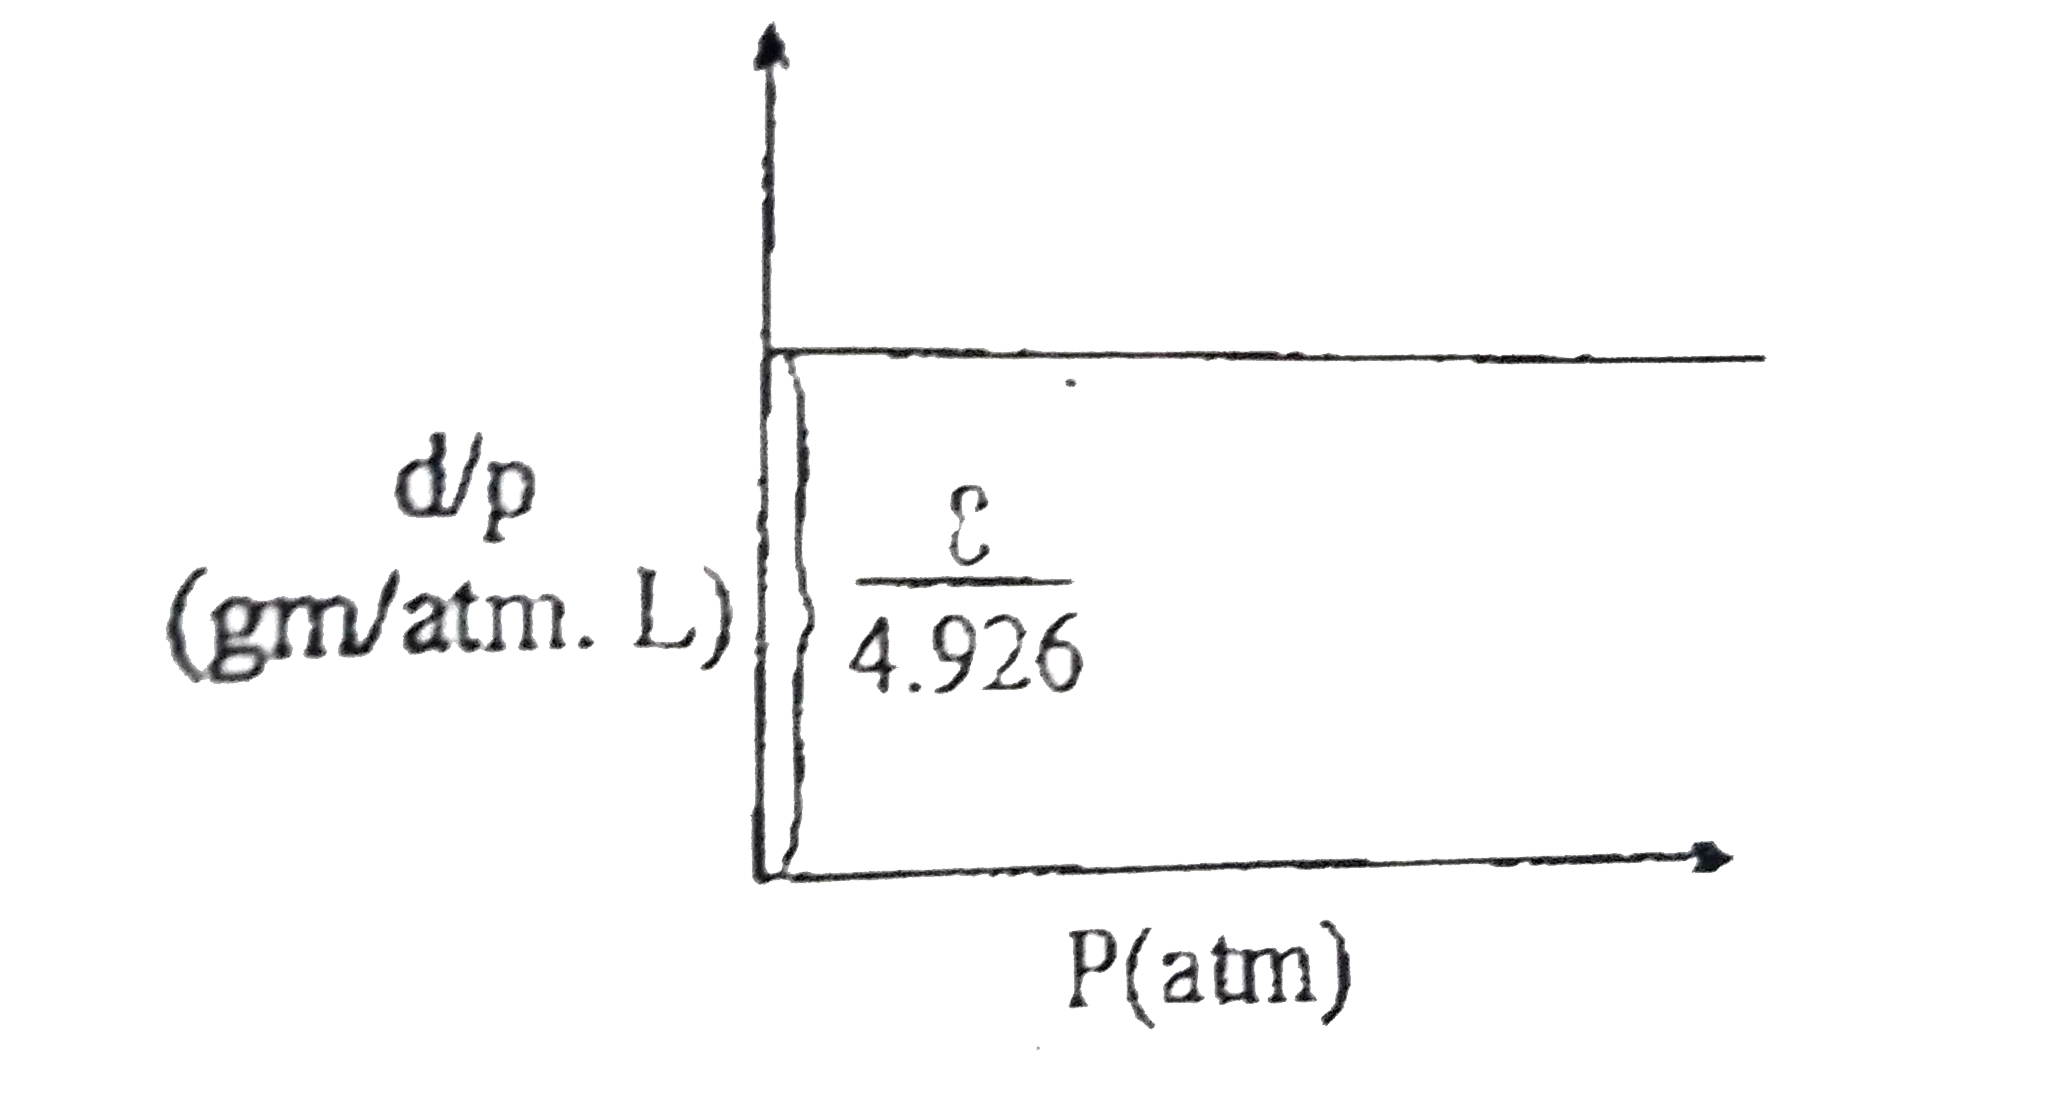
- From the graph of (d)/(P) vs P at a constant temperature of 300K. Calc...
Text Solution
|
- P vs V graph is plotted for 1 mole of hypothetical gas. Range of a/b f...
Text Solution
|
- For the given isotherm (P in atm and V in L) for one mole of an ideal ...
Text Solution
|
- Z us P graph is plotted for 1 mole of hypothetical gas. Volume of gas ...
Text Solution
|
- From the graph of (d)/(P) us P at a constant temperature of 300 K. cal...
Text Solution
|
- The graph of P vs V is given at temperature and number of moles : The ...
Text Solution
|
- At a constant pressure P, the plot of volume (V) as a function of temp...
Text Solution
|
- If PD vs P (where P si pressure in atm and D is density in gm/lit). Is...
Text Solution
|
- From the graph of (d)/(P) vs P at a constant temperature of 300K. Calc...
Text Solution
|