


Similar Questions
Explore conceptually related problems
Recommended Questions
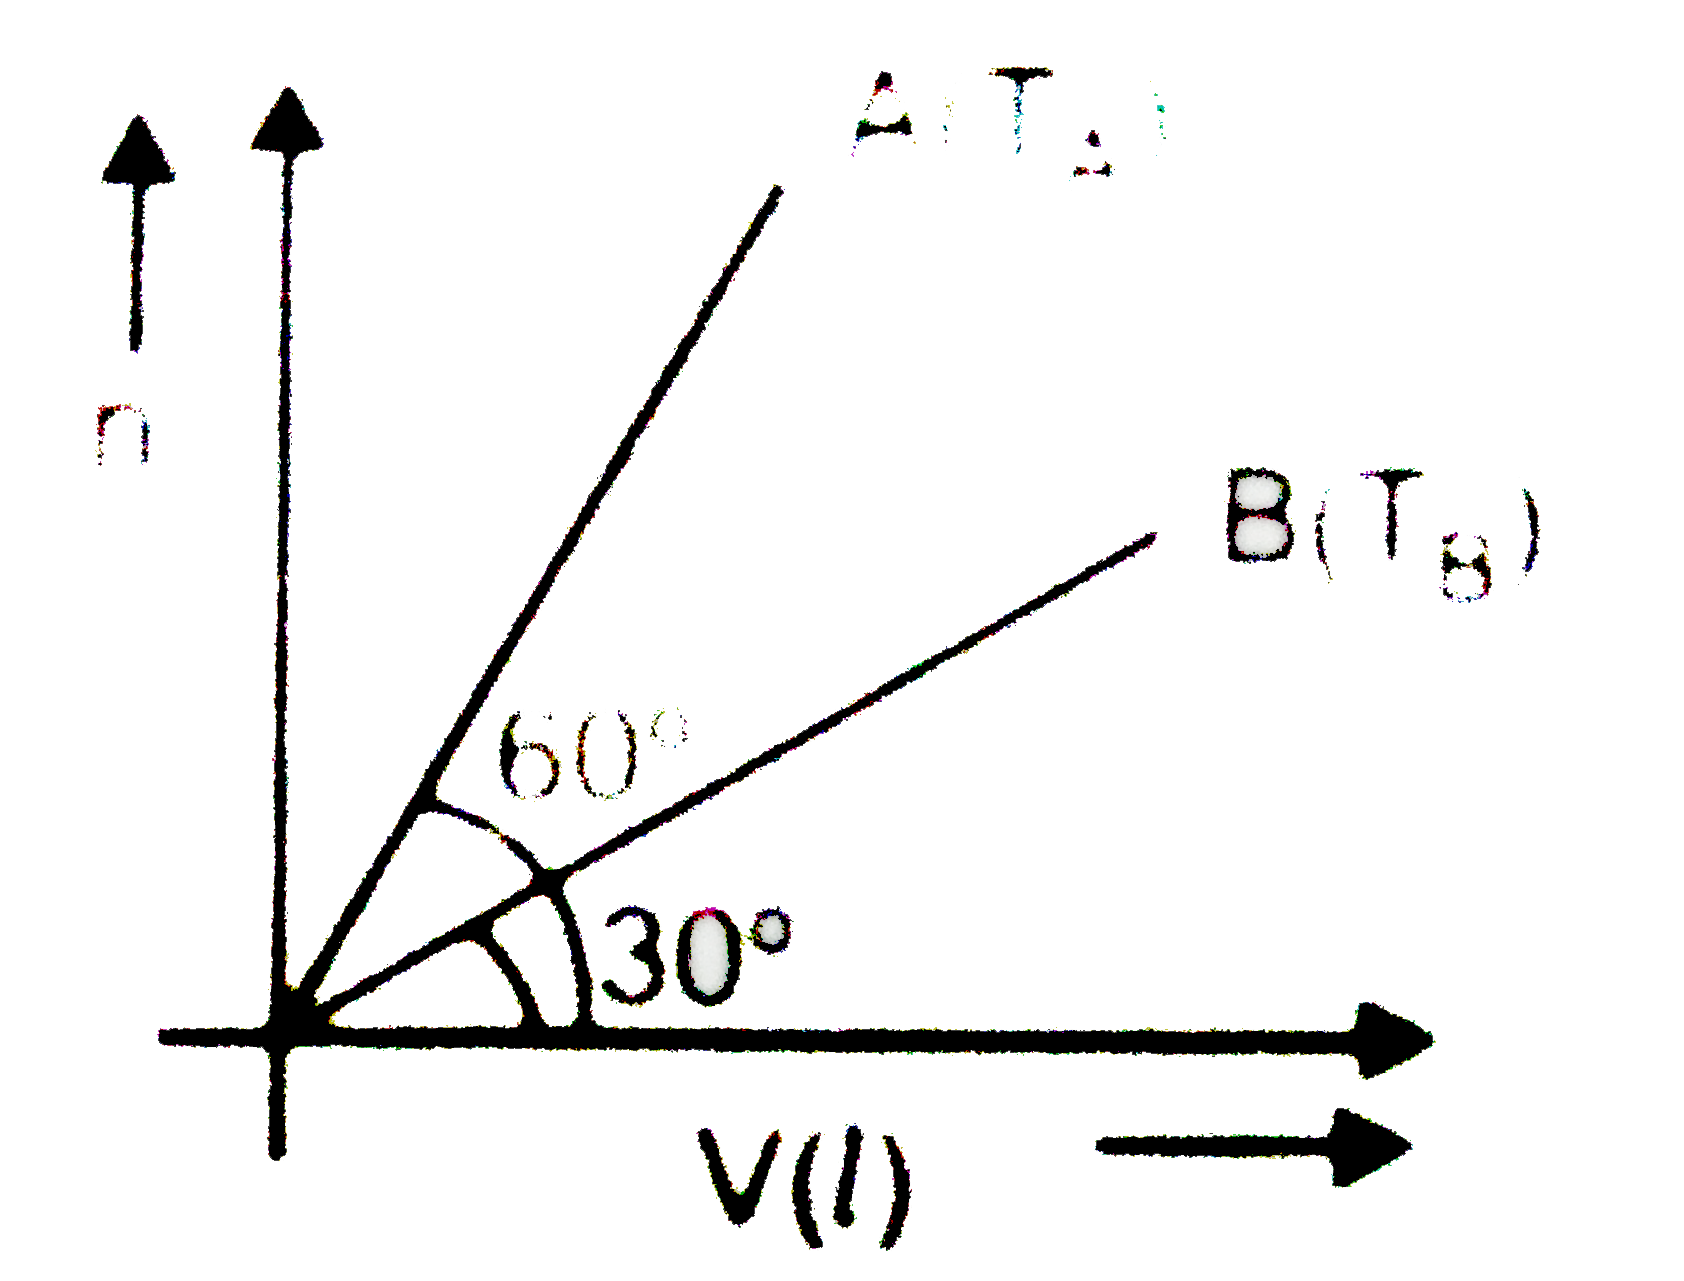
- For two samples of ideal gases A and B curves are plotted n vs V (volu...
Text Solution
|
- If a plot a V vs .^(@)C at constant pressure is drawn, at what tempera...
Text Solution
|
- P-V plot for two gases (assuming ideal) during adiabatic processes are...
Text Solution
|
- A graph is plotted between p (atm) vs t^(@)C for 10 mol of an ideal ga...
Text Solution
|
- For two samples of ideal gases A and B curves are plotted n vs V (volu...
Text Solution
|
- At constant temperature of 273 K, (1)/(V) vs P are plotted for two ide...
Text Solution
|
- P-V plot for two gases (assuming ideal) during adiabatic processes are...
Text Solution
|
- At constant temperature of 273K. (1)/(v) vs are plotted for two ideal ...
Text Solution
|
- Plot density vs pressure for a fixed mass of an ideal gas at a constan...
Text Solution
|